edit_curv
interactive modal (blocking) graphic curve editor
Syntax
[x, y, ok, gc] = edit_curv()
[x, y, ok, gc] = edit_curv(y)
[x, y, ok, gc] = edit_curv(x, y)
[x, y, ok, gc] = edit_curv(x, y, job)
[x, y, ok, gc] = edit_curv(x, y, job, titles)
[x, y, ok, gc] = edit_curv(x, y, job, titles, gc)
[x, y, ok, gc] = edit_curv(Axes, ..)

[x, y, ok, gc] = edit_curv(hCurve)
[x, y, ok, gc] = edit_curv(hCurve, job)
[x, y, ok, gc] = edit_curv(hCurve, job, titles)
[x, y, ok, gc] = edit_curv(hCurve, job, titles, gc)
Arguments
- x
- vector of initial or final x coordinates of the curve.
Default value:
1:length(y). - y
- vector of initial or final y coordinates of the curve. Default value:
[]. - hCurve
- Graphic handle of Polyline type: the existing curve to be edited.
- Axes
- Graphic handle of the axes in which the given curve must be displayed and edited. The axes may be in a figure or in a uicontrol frame.
- job
- a character string made of one to four characters in any order among
'a','d','x','y', setting authorizations:
Default value:"a": addition of points to the curve. "d": deletion of points of the curve. "x": moving points horizontally, along x. "y": moving points vertically, along y. "adxy". - titles
- a vector of three character strings:
[axes_title, x_axis_legend, y_axis_legend]. By default, the current or default legends and title are unchanged. - gc
- a list of graphic parameters:
gc=list(dataBounds, xyTicks, lineStyles)dataBounds: [xmin, ymin, xmax, ymax]values to assign togca().data_boundsas new axes bounds.xyTicks: (unused) graduation parameters [nx,Nx,ny,Ny]: Nx = number of major ticks along the x axis (-1 for autoticking). nx = number of minor ticks between 2 major ticks. Ny, ny: same thing along the y axis.lineStyles: [line_style, colorIndex, thickness, mark_style]of the curve.%nanstands for keeping the default value, that are[1 1 2 1](solid black 2-thick line with "+" marks).list(,, lineStyles)will use default values fordataBoundsandxyTicks. - ok
- Boolean: %t when
edit_curv()is quit through the 'ok' menu. %F otherwise ('Abort' menu, Figure closed through its X cross..).
Description
Edition place:
edit_curv(), edit_curv(y),
edit_curv(x,y) and edit_curv(x,y,…)
open a new figure, edit the curve in this one, and finally close the figure when
leaving. edit_curv(Axes,…) edits the curve in the given existing
Axes set on a uicontrol frame or in a figure and made the current one.
edit_curv(hCurve,…) edits the given curve in its parent Axes.
Figure, Axes and curve settings and styles:
edit_curv(Axes,…) and edit_curv(hCurve,…)
change some settings of the figure: The graphics toolbar and existing menus are hidden.
Some menus are added; the title and x and y axis legends may be changed;
a grid is displayed in the axes area; the style of
the hCurve is changed (thickness, color, markers..).
When leaving, all initial settings are restored.
edit_curv(…) edits the curve in blocking mode: While editing,
it waits for validating or aborting the edition before returning to the calling
level and performing the next instruction.
The edited curve is set as the current graphical entity before returning.
Actions
Enabled actions are set by the job parameter.
Clicking or/and pressing are done using the left button of the mouse.
| Append a point: Click out of the curve. The new point and a segment connecting it to the nearest tip of the curve are drawn. |
| Insert a point: Click on an existing segment. The new point is drawn where the segment is split. |
| Move a point: Click on it ; move the mouse to where the point should go: the point and its segments follow the mouse ; click to set and stop moving the point at its final position. |
| Delete a point: Click on it. Then press the <suppr> key. |
Cancel the previous action (Undo):
Press CTRL Z keys (or use the Control → Undo menu) |
Cancel the previous cancelation (Redo):
Press CTRL Y keys. |
Menus
- Control
Ok Validates the current curve, and returns Undo (Ctrl-Z) Iteratively cancels the previous curve's modification. Restores its previous state. Redo (Ctrl-Y) Iteratively restores the last canceled modification of the curve. Abort Restores the initial curve, and returns. - Data
Load Opens an interface to choose and load a *.scg graphic file, or a *.sod binary data file, or *.xy text file. A *.scg file is then scanned for a polyline curve, whose .data xy coordinates are loaded. A *.sod file is scanned for a variable named xybeing a matrix of real numbers. Thenxy(:,1:2)coordinates are loaded. A *.xy file is assumed to contain a matrix of reals. Its first two columns are loaded as x and y coordinates.Save Opens an interface to choose a directory and *.sod or *.xy filename. Then builds a matrix of size N×2 named xywith the (x,y) coordinates of the edited curve, and records the matrix in the chosen .sod binary or .xy text file.Clear Clears the current edited curve. Reframe Sets the axes bounds to the curve's ones. Bounds Opens a pop-pup window prompting the user to enter new [xmin, ymin, xmax, ymax]bounds of the axes.
Non-blocking edition
An existing curve may be edited in a non-blocking mode, but without constrain on x or y:
- Activate the asynchronous editor for the targeted figure, either by running
useeditor(gcf().figure_id), or by clicking on the edit button in the graphics toolbar.
 - Click or double-click on the curve to edit. Double-click shows its points. Then change its position or shape.
- Finally, disable the editor:
useeditor(gcf().figure_id)
Examples
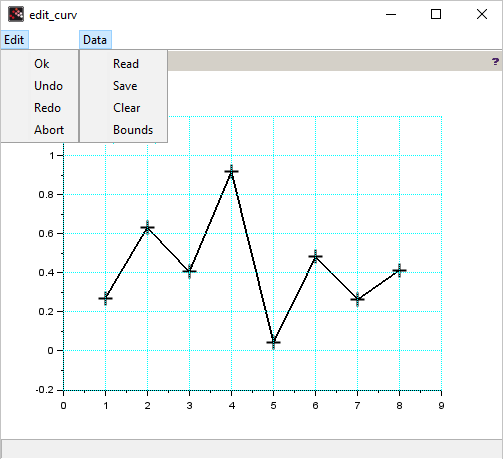
Creating a curve from scratch in an independent GUI, with default styles:[x, y] = edit_curv(); [x y]'
[x, y] = edit_curv(rand(1,8), "y");
[x y]'
edit_curv():
Editing a curve in a given subplot:
See also
- non-blocking curve editor — 対話型プロットエディタ
- Property editor — グラフィックオブジェクトエディタの機能に関する説明
History
| バージョン | 記述 |
| 2023.1 |
|
| Report an issue | ||
| << dragrect | interaction | event handler functions >> |