bar
棒ヒストグラム
呼び出し手順
bar(y)
bar(x, y)
bar(x, y, width, colors, style)
bar(x, y [,width] [,colors] [,style])
bar(h, x, y ..)
引数
- h
axes ハンドル, (デフォルト: h=gca() ).
- y
scalar, vector of size N, or matrix N*M of real numbers or encoded integers, with
- N : number of groups (each group of bars gathered on/around an x position)
- M : number of categories in each group
- x
a real scalar or a vector of size N. By default,
- If
yis a vector:x=1:length(y) - If
yis a matrix:x=1:size(y,"r")
- If
- width
(オプション), 実数スカラー, bar の幅 (利用可能な空間の割合) を定義 (デフォルト: 0.8, すなわち 80%).
- colors
(オプション) Single string or vector of M strings: colors names (among predefined ones) or "#RRGGBB" hexadecimal codes of categories colors. Default = default plot() colors series, starting with "blue".
- style:
文字列, 'grouped' または 'stacked' (デフォルト: 'grouped').
説明
bar(y,...) : y がベクトルの場合, bar 関数は
polyline_style 6型を有するポリラインを描画します.
y がベクトルの場合, bar はベクトルyをベクトル1:size(y,'*')に対して
描画します. y が行列 N*M の場合, bar は M個のポリライン(6型)を描画し,
各ポリラインはyの列に対してベクトルx=1:size(y,1)に対応します.
bar(x,y,...) : yがベクトルの場合, bar 関数は
polyline_style 6型 を有するポリラインを描画します.
ただし, xの長さ = yの長さとなります.
y が行列 NxMの場合, bar 関数は6型 を有するM本のポリラインを描画します.
各ポリラインはyの列に対するベクトルxに対応します.
bar(h,...) : は描画を実行中のカレントの軸を定義します.
bar(...,width,...) : は棒の幅をパーセント単位で
定義します(通常: 0<width<=1).
bar(...,style,...) : は棒の描画方法を定義します.
y が行列 N*M の場合 (つまり, M本の6型ポリライン),
M個の棒を描画する方法が二種類あります.
styleオプション = 'grouped'により,
M個のポリラインをxの各要素に対して中心に置くことができます,
そして, style オプション 'stacked' によりこれらをスタックすることができます.
bar(...,colors,...) : defines the colors identifying categories
and filling the corresponding subsets of bars.
bar()を複数回コールする場合,
barhomogenize関数により
カレントの軸に含まれる
全ての棒(すなわち,6型のポリライン)の幅とスタイルを統一できます.
例
例
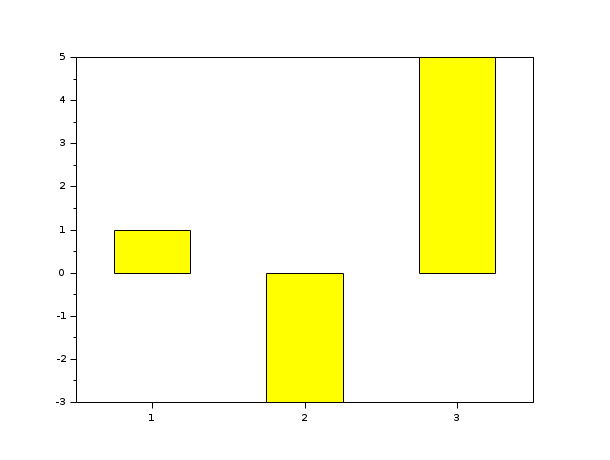
// 最初の例: 棒を描画 (すなわち,polyline_style type =6のポリライン) ただし,

// width=0.5 , colors='yellow' で default style='grouped', x=1:length(y).

scf(0);

y=[1 -3 5];

bar(y,0.5,'yellow');
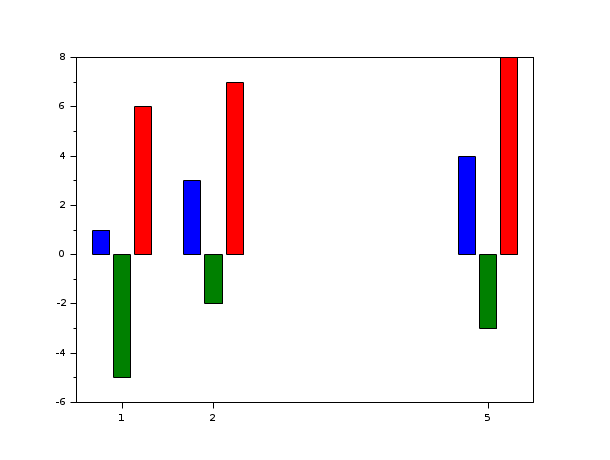
// 2番目の例: 棒を 3 つ描画 (すなわち,polyline_style type =6の3個のポリライン),default style='grouped'

scf(1);

x=[1 2 5]; y=[1  -5 6;3 -2 7;4  -3 8];

bar(x,y);
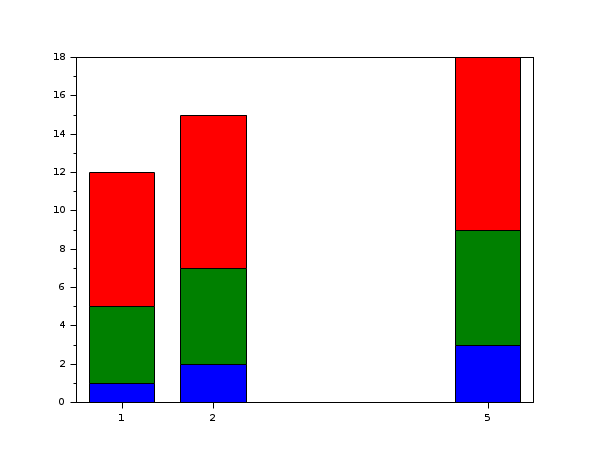
// 3番目の例 : style='stacked'.

scf(2);

x=[1 2 5]; y=[1 4 7;2 5 8;3 6  9];

bar(x,y,'stacked');
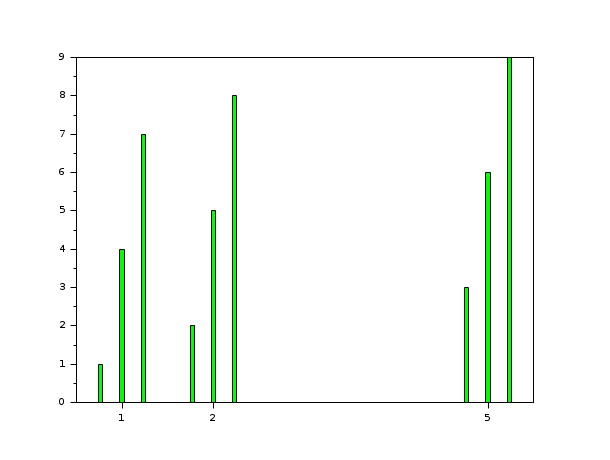
// 4番目の例: width=0.2;colors='green'; default style='grouped'

scf(3);

x=[1 2 5]; y=[1 4 7;2 5 8;3 6 9];

bar(x,y,0.2,'green');
参照
- barh — 棒ヒストグラムの水平表示
- barhomogenize — カレントの軸に含まれる棒グラフを均質化する
- histplot — ヒストグラムをプロットする
- plot — 2Dプロット
- named colors — 色の名前のリスト
- polyline_properties — Polylineエンティティプロパティの説明
- bar3d — 3D棒グラフ
履歴
| バージョン | 記述 |
| 6.0.1 |
|
| Report an issue | ||
| << bar_histogram | bar_histogram | barh >> |