fec
dessin en pseudo-couleurs d'une surface définie sur un maillage constitué de polygones convexes
Séquence d'appel
fec(x,y,triangles,func,[strf,leg,rect,nax,zminmax,colminmax])
Paramètres
- x,y
deux vecteurs de taille
n,(x(i),y(i))donne les coordonnées du sommeti- func
un vecteur de taille
n:func(i)donne la valeur de la fonction à représenter- triangles
une matrice
[Ntr, N+2]. Chaque ligne detrianglesreprésente un polygone du maillagetriangles(j) = [number,node1,node2,node3, ..., nodeN, flag].node1,node2,node3, ..., nodeNsont les numéros des sommets qui constituent le polygone j. number est le numéro du polygone et flag est un entier qui n'est pas utilisé par fec.- strf,leg,rect,nax
voir plot2d
- zminmax
parfait pour faire des animations avec fec.
zminmaxest un vecteur de taille 2 [zmin zmax] qui donne les z associés à la première et la dernière couleur (de la table des couleurs courante). Plus exactement si la table des couleurs a nc couleurs et si on note dz = (zmax-zmin)/nc, alors la partie du maillage où zmin + (i-1)dz <= z < zmin + i dz est remplie avec la couleur i). Par défaut zmin = min(func) et zmax = max(func). Si vous voulez faire une animation avec des valeurs de func changeant en fonction du temps, prenez zmin et zmax égaux au minimum et maximum globaux. ATTENTION : pour les valeurs de func plus grandes que zmax la dernière couleur est utilisée, et pour les valeurs plus petites que zmin la première couleur est utilisée (on ne voit donc pas que les niveaux de zminmax sont franchis).- colminmax
un vecteur de 2 entiers positifs colminmax=[colmin colmax] avec 1 <= colmin < colmax <= nc (où nc est la taille de la table des couleurs). Permet de définir un sous-ensemble de la table des couleurs à utiliser, ici cmap(colmin:colmax). Par défaut toute la table des couleurs est utilisée.
- colout
un vecteur de 2 entiers [under_min_col upper_max_col]
- mesh
un booléen, valeur par défaut %f (doit être %t pour afficher le maillage)
Description
Cette fonction est utile pour afficher les solutions des équations obtenues par la méthode des éléments finis, ou simplement pour afficher une fonction basée sur un maillage constitué de polygones.
Pour des raisons historiques, le troisième argument d'entrée est nommé triangles, mais fec accepte tous les types de polygones convexes.
Voir les fonctions de démonstration dans le répertoire
demos/fec.
fec.ex1 est une simple démo dans laquelle le maillage et
la fonction sont construits en langage Scilab.
fec.ex2 est un exemple où le maillage est construit avec
un mailleur externe (type amdba). Un ensemble de macros
(macros.sci) peut être utilisé pour lire les fichiers de
données correspondants.
Exemples
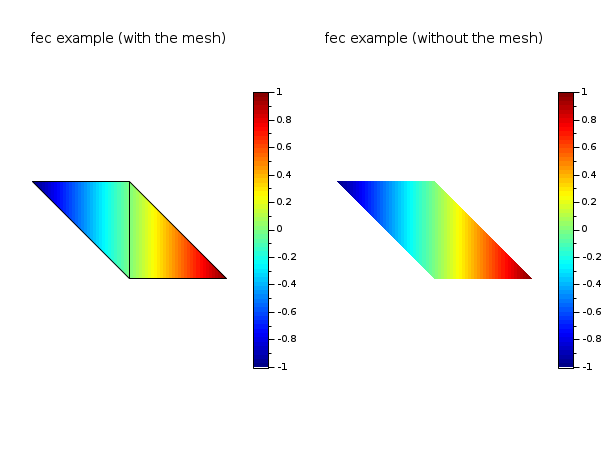
// define a mini triangulation (4 vertices, 2 triangles)
x = [0 1 0 -1];
y = [0 0 1  1];
T = [1 1 2 3 1;
     2 3 4 1 1];
z = [0 1 0 -1];  // values of the func at each vertices
clf()
gcf().color_map = jetcolormap(64);
subplot(1,2,1)
  colorbar(-1,1)
  fec(x,y,T,z,strf="040",mesh=%t)
  xtitle("fec example (with the mesh)")
subplot(1,2,2)
  colorbar(-1,1)
  fec(x,y,T,z,strf="040")  // rmq: mesh=%f by default
  xtitle("fec example (without the mesh)")
show_window()
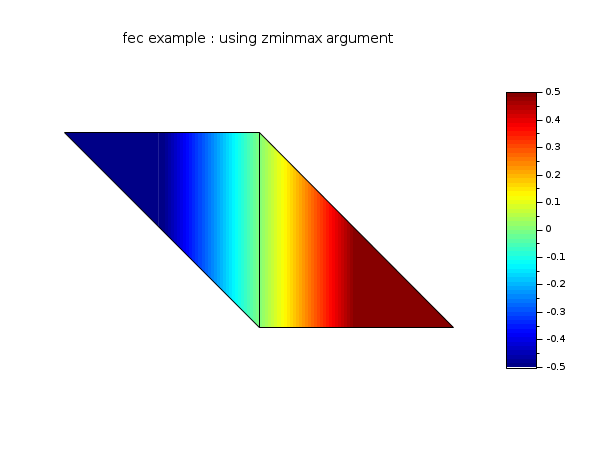
// define a mini triangulation (4 vertices, 2 triangles)
x = [0 1 0 -1];
y = [0 0 1  1];
T = [1 1 2 3 1;
     2 3 4 1 1];
z = [0 1 0 -1];  // values of the func at each vertices
// this example shows the effect of zminmax and uses the
// previous example data (you have to execute the it before)
clf()
gcf().color_map = jetcolormap(64);
colorbar(-0.5,0.5)  // be careful colorbar must be set by hands !
fec(x,y,T,z,strf="040", zminmax=[-0.5 0.5], mesh=%t)
xtitle("fec example : using zminmax argument")
show_window()
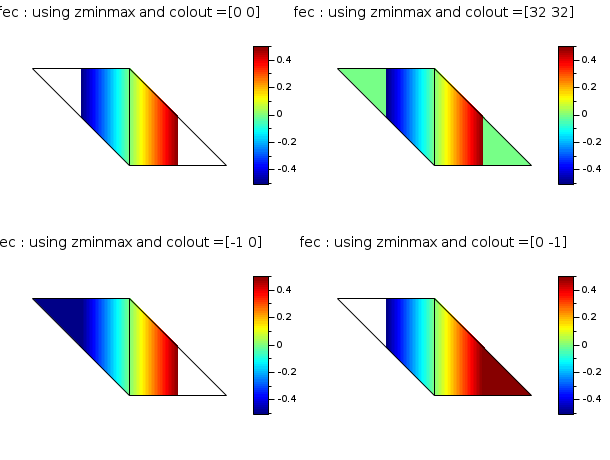
// define a mini triangulation (4 vertices, 2 triangles)
x = [0 1 0 -1];
y = [0 0 1  1];
T = [1 1 2 3 1;
     2 3 4 1 1];
z = [0 1 0 -1];  // values of the func at each vertices
// this example shows the effect of zminmax and colout. It uses
// also the data of the first example (you have to execute the it before)
clf()
gcf().color_map = jetcolormap(64);
subplot(2,2,1)
  colorbar(-0.5,0.5)
  fec(x,y,T,z,strf="040", zminmax=[-0.5 0.5], colout=[0 0], mesh=%t)
  xtitle("fec : using zminmax and colout =[0 0]")
subplot(2,2,2)
  colorbar(-0.5,0.5)
  fec(x,y,T,z,strf="040", zminmax=[-0.5 0.5], colout=[32 32], mesh=%t)
  xtitle("fec : using zminmax and colout =[32 32]")
subplot(2,2,3)
  colorbar(-0.5,0.5)
  fec(x,y,T,z,strf="040", zminmax=[-0.5 0.5], colout=[-1 0], mesh=%t)
  xtitle("fec : using zminmax and colout =[-1 0]")
subplot(2,2,4)
  colorbar(-0.5,0.5)
  fec(x,y,T,z,strf="040", zminmax=[-0.5 0.5], colout=[0 -1], mesh=%t)
  xtitle("fec : using zminmax and colout =[0 -1]")
show_window()
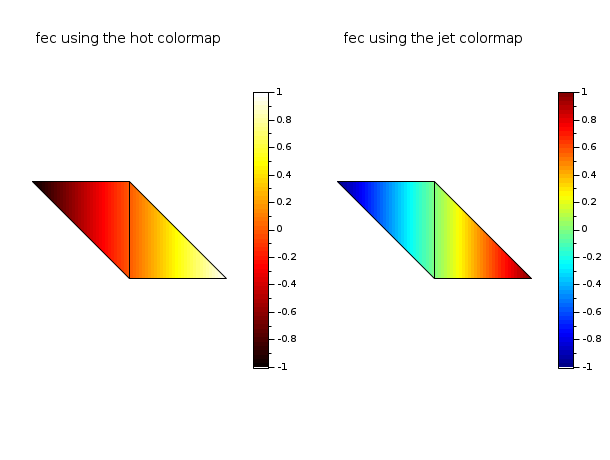
// define a mini triangulation (4 vertices, 2 triangles)
x = [0 1 0 -1];
y = [0 0 1  1];
T = [1 1 2 3 1;
     2 3 4 1 1];
z = [0 1 0 -1];  // values of the func at each vertices

// this example shows a feature from colminmax:
// playing with 2 colormaps for 2 subplots. It
// uses also the data of the first example.
clf()
gcf().color_map = [hotcolormap(64); jetcolormap(64)];
subplot(1,2,1)
  colorbar(-1,1,[1 64])
  fec(x,y,T,z,strf="040", colminmax=[1 64], mesh=%t)
  xtitle("fec using the hot colormap")
subplot(1,2,2)
  colorbar(-1,1,[65 128])
  fec(x,y,T,z,strf="040", colminmax=[65 128], mesh=%t)
  xtitle("fec using the jet colormap")
show_window()
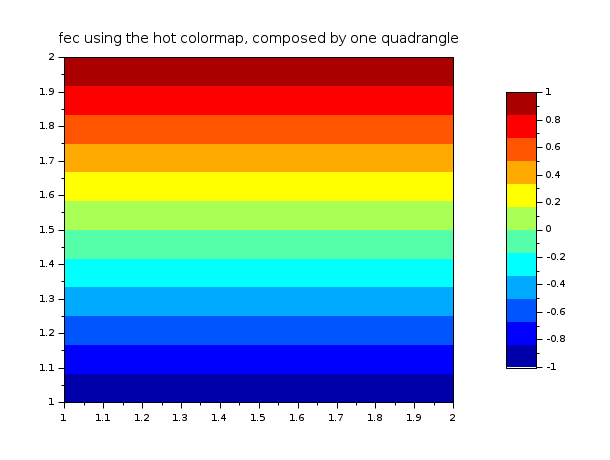
// define a mapping with one quadrangle (4 vertices, 1 quadrangle)
x = [1 2 2 1];
y = [1 1 2 2];
T = [1 1 2 3 4 0];
z = [-1; -1; 1; 1];  // values of the func at each vertices

clf()
f = gcf();
f.color_map = jetcolormap(12);
colorbar(-1,1);
fec(x,y,T,z,mesh=%t)
xtitle("fec using the hot colormap, composed by one quadrangle")
Voir aussi
- Sfgrayplot — smooth 2D plot of a surface defined by a function using colors
- Sgrayplot — smooth 2D plot of a surface using colors
History
| Version | Description |
| 5.5.2 | Le maillage peut désormais être consitué de polygones convexes. |
| Report an issue | ||
| << fchamp | 2d_plot | fec properties >> |