meshgrid
Create matrices or 3-D arrays from vectors replicated in 2 or 3 dimensions
Syntax
U = meshgrid(u)
[U, V] = meshgrid(u)
[X, Y] = meshgrid(x, y)
[X, Y, Z] = meshgrid(x, y, z)
Arguments
- u, x, y, z
- Vectors of any types, of lengths nu, nx, ny, nz.
- U, V
- Square matrices of size nu x nu
- X, Y, Z
- Matrices or hypermatrices of the same size [ny, nx] or [ny, nx, nz].
Description
meshgrid(..) builds matrices or 3-D hypermatrices by replicating input vectors along 2 or 3 dimensions.
 | To create arrays of size [nx, ny] instead of
[ny, nx], or with more than 3 dimensions, please use
ndgrid(x, y) or ndgrid(x, y, z,..). |
 | Most of Scilab 2D or 3D graphical functions like champ(),
grayplot(), Sgrayplot(),
plot3d(), contour(), etc.. work with grids
generated with ndgrid(), not from
meshgrid(). Data computed on grids coming from
meshgrid() will require being transposed (please see the
example thereafter). |
Examples
[X, Y] = meshgrid(0:2)
--> [X, Y] = meshgrid(0:2)
 X  =
   0.   1.   2.
   0.   1.   2.
   0.   1.   2.

 Y  =
   0.   0.   0.
   1.   1.   1.
   2.   2.   2.
[X, Y] = meshgrid(["a" "bc" "αβγδ"], [-3 5])
--> [X, Y] = meshgrid(["a" "bc" "αβγδ"], [-3 5])
 X  =
!a  bc  αβγδ  !
!a  bc  αβγδ  !

 Y  =
  -3.  -3.  -3.
   5.   5.   5.
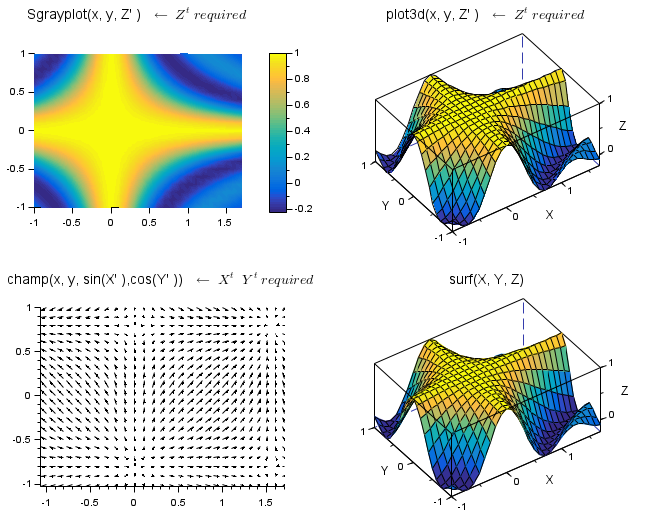
Application to grids for graphics:
// Generating data
x = -1:0.1:1.7;
y = -1:0.1:1;
[X, Y] = meshgrid(x, y);
Z = sinc(2*%pi * X.*Y);

// Setting the graphic figure
clf
drawlater
gcf().color_map = parulacolormap(64);
gcf().axes_size = [650 530];

// Plotting
subplot(2,2,1)
Sgrayplot(x, y, Z')
title(["Sgrayplot(x, y, Z'' ) " "$←\;Z^t\; required$"], "fontsize",3)
isoview, colorbar

subplot(2,2,2)
plot3d(x, y, Z', -125,50)
gce().color_flag = 1;
title(["plot3d(x, y, Z'' ) " "$←\;Z^t\; required$"], "fontsize",3)
isoview

subplot(2,2,3)
champ(x,y,sin(2*X'),cos(2*Y'))
title(["champ(x, y, sin(X'' ),cos(Y'' ))" "$←\;X^t\;\;Y^t\; required$"], "fontsize",3)
isoview

subplot(2,2,4)
surf(X, Y, Z)
title("surf(X, Y, Z)", "fontsize",3)
isoview

gcf().children.tight_limits = ["on" "on" "on"];
drawnow
See also
| Report an issue | ||
| << logspace | elementarymatrices | ndgrid >> |