barhomogenize
カレントの軸に含まれる棒グラフを均質化する
呼び出し手順
barhomogenize()
barhomogenize(h)
barhomogenize([h,] style)
barhomogenize([h,] width)
barhomogenize([h,] style, width)
パラメータ
- h
軸ハンドル, (デフォルト: h=gca() ).
- style
文字列,
'grouped'(デフォルト), または'stacked'.- width
(オプション), 実数スカラー, bar の幅 (利用可能な空間の割合) を定義 (デフォルト: 0.8).
説明
bar を複数回コールする場合,
barhomogenize 関数は,カレントの軸に含まれる
全ての棒(すなわち,polyline_style 6型)の幅とスタイルを
均質化します.
これらの棒は同じxデータを有する必要があります
barhomogenize( ) : この場合,
デフォルト値,h=gca(), width=0.8, style='grouped' が使用されます.
barhomogenize(h,...) :
描画対象のカレントの軸を定義します.
barhomogenize(...,style,...) :
棒の描画方法を定義します.
オプション = 'grouped'により,
M個のポリラインをxの各要素に対して中心に置くことができ,
そして, オプション 'stacked' によりこれらをスタックすることができます.
barhomogenize(...,width) :
棒の幅をパーセント単位で定義します
(通常: 0<width<=1).
例
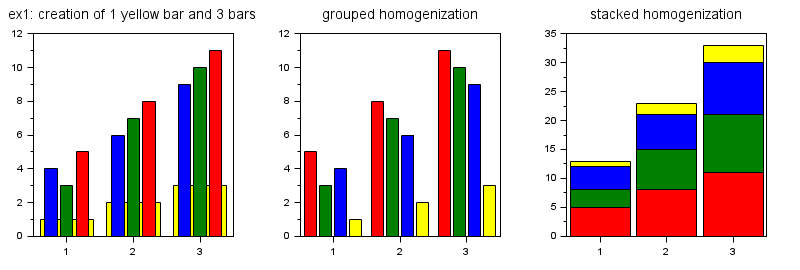
最初の例: 黄色の棒を1つ (polyline_style=6のポリラインを1本)と棒を3つ (polyline_style=6のポリラインを3本)
subplot(2,3,1)
xtitle('ex1: creation of 1 yellow bar and 3 bars ')
x=1:3; y1=1:3; y2=[4 3 5;6 7 8;9 10 11];
bar(x,y1,'yellow');bar(x,y2);

// これら4本の棒のグループとして均質化
subplot(2,3,2)
xtitle('grouped homogenization')
x=1:3; y1=1:3; y2=[4 3 5;6 7 8;9 10 11];
bar(x,y1,'yellow');bar(x,y2);
barhomogenize('grouped',1);

// これら4本の棒のスタックとして統一化
subplot(2,3,3)
xtitle('stacked homogenization')
x=1:3; y1=1:3; y2=[4 3 5;6 7 8;9 10 11];
bar(x,y1,'yellow');bar(x,y2);
barhomogenize('stacked',1);
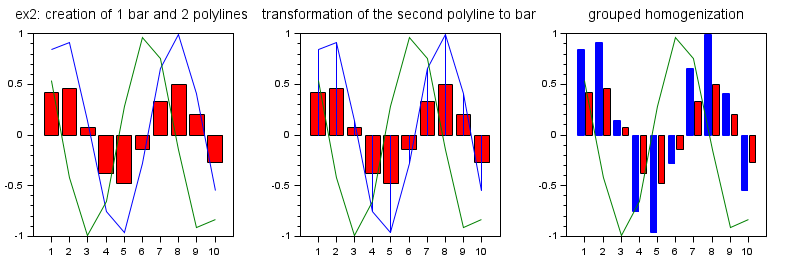
第2の例 : 赤色の棒を1つ (polyline_style=6のポリラインを1本) と type=1のポリラインを2本 (plot 関数をコール)
subplot(2,3,4)
xtitle('ex2: creation of 1 bar and 2 polylines')
x=1:10; y=sin(x)/2;
bar(x,y,'red')
x1=1:10;y1=[sin(x);cos(x)]
plot(x1,y1)

// 2本目のポリラインのpolyline_style 型をplotから修正 (このポリラインは棒になります)
subplot(2,3,5)
xtitle('transformation of the second polyline to bar')
x=1:10; y=sin(x)/2;
bar(x,y,'red')
x1=1:10;y1=[sin(x);cos(x)]
plot(x1,y1)
e=gce(); e2=e.children(2); e2.polyline_style=6;

// (bar 関数による)最初の棒(修正による)と2個目の棒の均質化.
subplot(2,3,6)
xtitle('grouped homogenization')
x=1:10; y=sin(x)/2;
bar(x,y,'red')
x1=1:10;y1=[sin(x);cos(x)]
plot(x1,y1)
e=gce(); e2=e.children(2); e2.polyline_style=6;
barhomogenize();
// 幅とスタイルを変更
//barhomogenize('stacked',0.5);
//barhomogenize('stacked',1);
参照
- bar — 棒ヒストグラム
- histplot — ヒストグラムをプロットする
- polyline_properties — Polylineエンティティプロパティの説明
| Report an issue | ||
| << barh | bar_histogram | Color management >> |