Scilab 5.5.2
- Справка Scilab
- Графики
- 2d_plot
- ВидЛинии
- свойства Matplot
- Sfgrayplot
- champ
- champ1
- comet
- contour2d
- contour2di
- contourf
- errbar
- Matplot
- Matplot1
- Sgrayplot
- champ properties
- contour2dm
- fchamp
- fcontour2d
- fec
- fec properties
- fgrayplot
- fplot2d
- grayplot
- grayplot properties
- graypolarplot
- histplot
- paramfplot2d
- plot
- plot2d
- plot2d1
- plot2d2
- plot2d3
- plot2d4
- polarplot
Please note that the recommended version of Scilab is 2026.0.0. This page might be outdated.
See the recommended documentation of this function
errbar
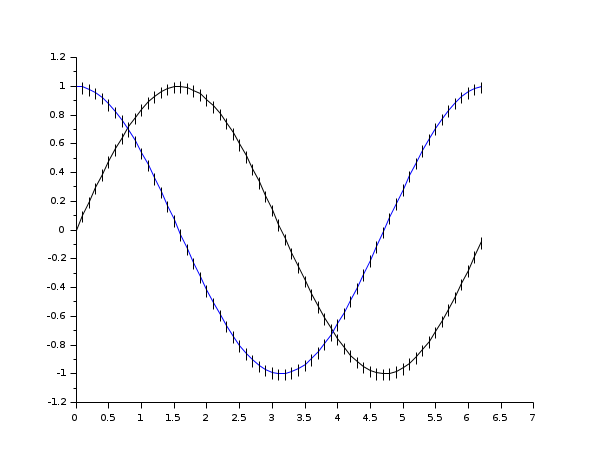
добавление вертикальных полос ошибок на двумерном графике
Последовательность вызова
errbar(x, y, em, ep)
Аргументы
- x, y, em, ep
четыре матрицы одного и того же размера.
Описание
Функция errbar добавляет вертикальные полосы
ошибок на двумерном графике. x и
y имеют тот же смысл, что и в функции
plot2d.
em(i,j) и ep(i,j) указывают
интервал ошибки для значения y(i,j):
[y(i,j)-em(i,j),y(i,j)+ep(i,j)].
Введите команду errbar(), чтобы посмотреть демонстрацию.
Примеры

Смотрите также
- plot2d — 2D plot
| Report an issue | ||
| << contourf | 2d_plot | Matplot >> |