- Справка Scilab
- Графики
- 2d_plot
- ВидЛинии
- свойства Matplot
- Sfgrayplot
- champ
- champ1
- comet
- contour2d
- contour2di
- contourf
- errbar
- Matplot
- Matplot1
- Sgrayplot
- champ properties
- contour2dm
- fchamp
- fcontour2d
- fec
- fec properties
- fgrayplot
- fplot2d
- grayplot
- grayplot properties
- graypolarplot
- histplot
- paramfplot2d
- plot
- plot2d
- plot2d1
- plot2d2
- plot2d3
- plot2d4
- polarplot
Please note that the recommended version of Scilab is 2026.0.0. This page might be outdated.
See the recommended documentation of this function
Sfgrayplot
сглаженный двумерный график поверхности, определённой через функцию, с использованием цветов
Последовательность вызова
Sfgrayplot(x, y, f, <opt_args>)
Sfgrayplot(x, y, f [,strf, rect, nax, zminmax, colminmax, mesh, colout])
Аргументы
- x, y
вещественные векторы-строки размером
n1иn2.- f
Scilab-функция (
z=f(x,y)).- <opt_args>
представляет последовательность инструкций
key1=value1, key2=value2, ..., гдеkey1,key2, ...может быть одним из следующих:strf,rect,nax,zminmax,colminmax,mesh,colout(о первых трёх см. plot2d, а о последних четырёх см. fec).- strf, rect, nax
см. plot2d.
- zminmax, colminmax, mesh, colout
см. fec.
Описание
Функция Sfgrayplot - это то же самое, что и
fgrayplot, но график сглажен. Для сглаживания
используется функция fec. Поверхность строится
в предположении, что она линейна на множестве треугольников,
построенных из сетки (здесь с n1=5, n2=3):
_____________
| /| /| /| /|
|/_|/_|/_|/_|
| /| /| /| /|
|/_|/_|/_|/_|
Чтобы увидеть цветовую шкалу, может быть использована функция colorbar (но вы должны знать (или вычислить) минимальное и максимальное значения).
Вместо функции Sfgrayplot, вы можете
использовать функцию Sgrayplot,
и это может быть несколько быстрее.
Введите команду Sfgrayplot(), чтобы посмотреть наглядную иллюстрацию.
Примеры
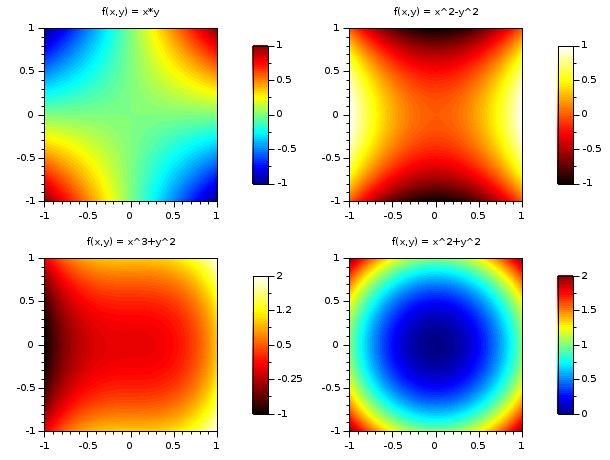
// Пример №1: построение 4 поверхностей
function z=surf1(x, y), z=x*y, endfunction
function z=surf2(x, y), z=x^2-y^2, endfunction
function z=surf3(x, y), z=x^3+y^2, endfunction
function z=surf4(x, y), z=x^2+y^2, endfunction
clf()
set(gcf(),"color_map",[jetcolormap(64);hotcolormap(64)])
x = linspace(-1,1,60);
y = linspace(-1,1,60);
drawlater() ;
subplot(2,2,1)
  colorbar(-1,1,[1,64])
  Sfgrayplot(x,y,surf1,strf="041",colminmax=[1,64])
  xtitle("f(x,y) = x*y")
subplot(2,2,2)
  colorbar(-1,1,[65,128])
  Sfgrayplot(x,y,surf2,strf="041",colminmax=[65,128])
  xtitle("f(x,y) = x^2-y^2")
subplot(2,2,3)
  colorbar(-1,2,[65,128])
  Sfgrayplot(x,y,surf3,strf="041",colminmax=[65,128])
  xtitle("f(x,y) = x^3+y^2")
subplot(2,2,4)
  colorbar(0,2,[1,64])
  Sfgrayplot(x,y,surf4,strf="041",colminmax=[1,64])
  xtitle("f(x,y) = x^2+y^2")
drawnow() ;
show_window()

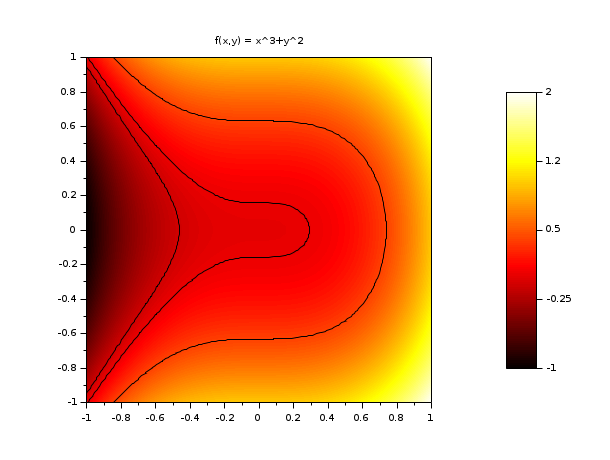
// Пример №2: построение surf3 и добавление некоторых контурных линий
function z=surf3(x, y), z=x^3+y^2, endfunction
clf()
x = linspace(-1,1,60);
y = linspace(-1,1,60);
set(gcf(),"color_map",hotcolormap(128))
drawlater() ;
colorbar(-1,2)
Sfgrayplot(x,y,surf3,strf="041")
contour2d(x,y,surf3,[-0.1, 0.025, 0.4],style=[1 1 1],strf="000")
xtitle("f(x,y) = x^3+y^2")
drawnow() ;
show_window()

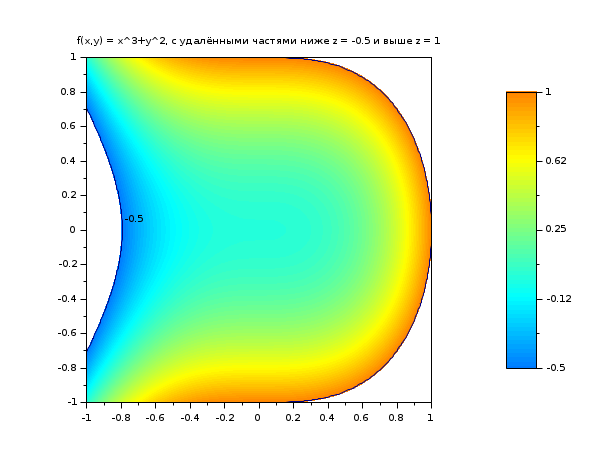
// Пример №3: построение surf3 и использование необязательных аргументов
//            zminmax и colout для ограничения графика в -0.5 <= z <= 1
function z=surf3(x, y), z=x^3+y^2, endfunction
clf()
x = linspace(-1,1,60);
y = linspace(-1,1,60);
set(gcf(),"color_map",jetcolormap(128))
drawlater() ;
zminmax = [-0.5 1]; colors=[32 96];
colorbar(zminmax(1),zminmax(2),colors)
Sfgrayplot(x, y, surf3, strf="041", zminmax=zminmax, colout=[0 0], colminmax=colors)
contour2d(x,y,surf3,[-0.5, 1],style=[1 1 1],strf="000")
xtitle("f(x,y) = x^3+y^2, с удалёнными частями ниже z = -0.5 и выше z = 1")
drawnow() ;
show_window()

Смотрите также
| Report an issue | ||
| << свойства Matplot | 2d_plot | champ >> |