Please note that the recommended version of Scilab is 2026.1.0. This page might be outdated.
See the recommended documentation of this function
tabul
frequency of values of a matrix or vector
Syntax
[m]=tabul(X [,order])
Arguments
- X
vector or matrix (of real or complex numbers or strings)
- order
(optional) a character equal to "d" or "i" (default value "d")
- m
a 2 columns matrix (if
Xis a numerical vector or matrix) or a list with 2 members (ifXis a string vector or matrix).
Description
This function computes the frequency of values of
the components of a vector or matrix X of numbers or
string characters :
- if X is a numerical vector or matrix
then
mis a two column matrix who contains in the first column the distinct values ofXand in the other column the number of occurrences of those values (m(i,2) is the number of occurrences of m(i,1)).- if X is a string vector or matrix
then
mis a list whose first member is a string (column) vector composed with the distinct values ofXand the second member is a (column) vector whose components are the number of occurrences of those values ( m(i)(2) is the number of occurrences of the string m(i)(1) ).
The optional parameter order must be "d" or "i" (by default
order="d") and gives the order (decreasing or increasing) the distinct
values of X will be sorted.
Examples
X = [2 8 0 3 7 6 8 7 9 1 6 7 7 2 5 2 2 2 9 7]
m1 = tabul(X)
m2 = tabul(X, "i")
X = ["ba" "baba" "a" "A" "AA" "a" "aa" "aa" "aa" "A" "ba"]
m = tabul(X,"i")
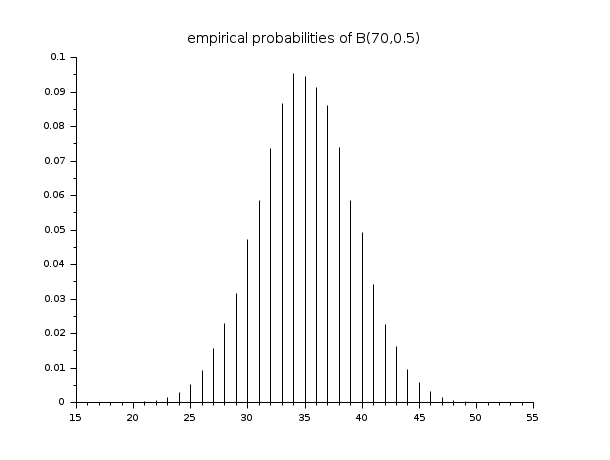
n = 50000;
X = grand(n,1,"bin",70,0.5);
m = tabul(X,"i");
clf()
plot2d3(m(:,1), m(:,2)/n)
xtitle("empirical probabilities of B(70,0.5)")
// computes the occurrences of words of the license of scilab
text = read(SCI+"/COPYING",-1,1,"(A)");     // read the scilab license
bigstr = strcat(text," ");                  // put all the lines in a big string
sep =  [" " "," "." ";" "*" ":" "-" """"];  // words separators
words = tokens(bigstr, sep);                // cut the big string into words
m = tabul(words);                           // computes occurrences of each word
[occ , p] = gsort(m(2));                    // sort by decreasing frequencies
results = [m(1)(p) string(occ)]             // display result
Bibliography
Wonacott, T.H. & Wonacott, R.J.; Introductory Statistics, fifth edition, J.Wiley & Sons, 1990.
| Report an issue | ||
| << quart | Empirical distribution | Multivariate Correl Regress PCA >> |