Please note that the recommended version of Scilab is 2026.0.1. This page might be outdated.
See the recommended documentation of this function
legends
グラフの凡例を描画
呼び出し手順
legends(strings,style,<opt_args>)
引数
- strings
文字列のベクトルで, strings(i) は i番目の曲線の凡例となります.
Scilab 5.2 以降, LaTeX または MathML 式 を記述することが可能です.
- style
大きさnの整数行ベクトル (プロット形式, plot2d の3番目のパラメータ) または 2 x n の整数行列. 後者の場合, style(1,k)はk番目の曲線のプロット形式, style(2,k) は線の種類(style(1,k)>0 の場合) またはマーカの色 ( style(1,k)<0の場合) です.
- <opt_args>
一連の命令
key1=value1,key2=value2,...を表し,key1,key2,...には以下のどれかを指定できます:- opt
凡例を描画する場所を指定します; このパラメータは整数フラグ(または等価な文字列フラグ)または 凡例ボックスの左上隅の座標を指定するベクトル [x,y] とすることができます. 最初の場合,以下の値を指定可能です:
- 1 または "ur"
凡例は右上隅に描画されます.
- 2 または "ul"
凡例は左上隅に描画されます.
- 3 または "ll"
凡例は左下隅に描画されます.
- 4 または "lr"
凡例は右下隅に描画されます.
- 5 または "?"
マウスにより対話的に配置(デフォルト).
- 6 または "below"
凡例はグラフの下に描画されます (適当にリサイズされます).
- with_box
論理値 (デフォルト値 %t) で,ボックス描画の有無を指定します.
- font_size
整数 (デフォルト値 1) で,凡例で使用されるフォントの大きさを指定します.
説明
カレントのプロットに指定された文字列をラベルとする凡例を表示します.
対話的な配置(opt=5 または opt="?")ではマウスで凡例ボックスを移動し, 左ボタンを押すことでリリースします.
この関数は plot2d の leg 引数よりも柔軟に凡例を配置することができます.
例
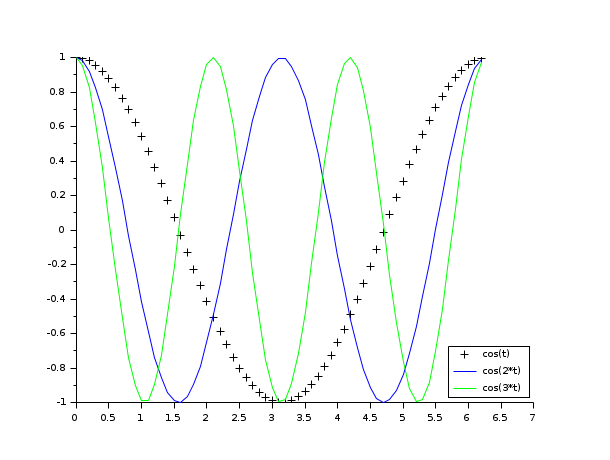
// 例 1

t=0:0.1:2*%pi;

plot2d(t,[cos(t'),cos(2*t'),cos(3*t')],[-1,2 3]);

legends(['cos(t)';'cos(2*t)';'cos(3*t)'],[-1,2 3],opt="lr")

t=0:0.1:2*%pi;

gca().line_style = 2;
plot2d(t,cos(t),style=5);

gca().line_style = 4;
plot2d(t,sin(t),style=3);

legends(["sin(t)";"cos(t)"],[[5;2],[3;4]], with_box=%f, opt="?")
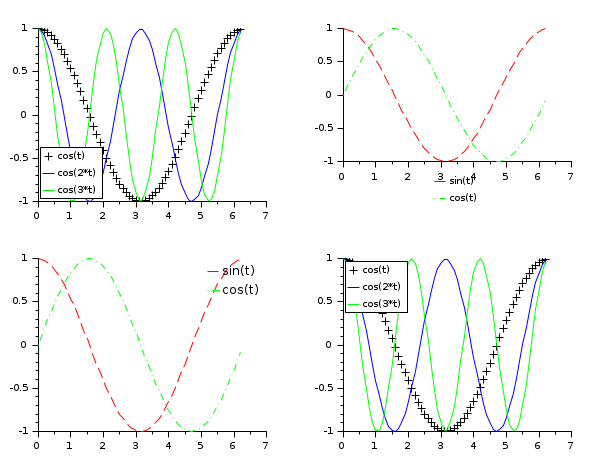
// 例 2

scf() ;

subplot(221)

t=0:0.1:2*%pi;

plot2d(t,[cos(t'),cos(2*t'),cos(3*t')],[-1,2 3]);

legends(['cos(t)';'cos(2*t)';'cos(3*t)'],[-1,2 3], opt=3 )

subplot(222)

gca().line_style = 2;
plot2d(t,cos(t),style=5);

gca().line_style = 4;
plot2d(t,sin(t),style=3);

legends(["sin(t)";"cos(t)"],[[5;2],[3;4]], with_box=%f, opt=6 )

subplot(223)

gca().line_style = 2;
plot2d(t,cos(t),style=5);

gca().line_style = 4;
plot2d(t,sin(t),style=3);

legends(["sin(t)";"cos(t)"],[[5;2],[3;4]], with_box=%f, opt=1, font_size=2 )

subplot(224)

t=0:0.1:2*%pi;

plot2d(t,[cos(t'),cos(2*t'),cos(3*t')],[-1,2 3]);

legends(['cos(t)';'cos(2*t)';'cos(3*t)'],[-1,2 3], opt=2, font_size=1 )

| Report an issue | ||
| << legend_properties | annotation | title >> |