Scilab-Branch-6.1-GIT
- Scilabヘルプ
- Graphics
- 2d_plot
- champ
- champ1
- champ_properties
- comet
- contour2d
- contour2di
- contour2dm
- contourf
- cutaxes
- errbar
- fchamp
- fec
- fec_properties
- fgrayplot
- fplot2d
- grayplot
- grayplot_properties
- graypolarplot
- histplot
- LineSpec
- loglog
- Matplot
- Matplot1
- Matplot_properties
- paramfplot2d
- plot
- plot2d
- plot2d2
- plot2d3
- plot2d4
- plotimplicit
- polarplot
- scatter
- semilogx
- semilogy
- Sfgrayplot
- Sgrayplot
Please note that the recommended version of Scilab is 2026.0.0. This page might be outdated.
However, this page did not exist in the previous stable version.
fplot2d
関数で定義された曲線の二次元プロット (obsolete)
呼び出し手順
fplot2d(xr,f,[style,strf,leg,rect,nax])
fplot2d(xr,f,<opt_args>)
引数
- xr
ベクトル.
- f
y=f(x)型の外部ルーチン. すなわち,scilab関数または 文字列として参照された動的にリンクされるルーチン.- style,strf,leg,rect,nax
plot2d参照- <opt_args>
plot2d参照
説明
 | fplot2d() is obsolete and will be removed from Scilab 6.2.x.
Please use plot(xr,f,..) instead. |
fplot2d は外部関数f
で定義された曲線をプロットします.
曲線は点(xr(i),f(xr(i))により
区分線形補間で近似されます.
f(x)の値はfeval(xr,f)により取得されます.
コマンド fplot2d() を入力すると,デモが表示されます.
例
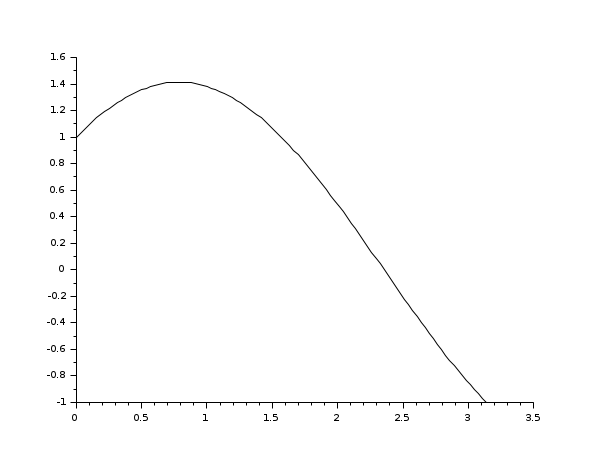
deff("y = f(x)", "y = sin(x)+cos(x)")
x = [0:0.1:10]*%pi/10;
fplot2d(x,f)

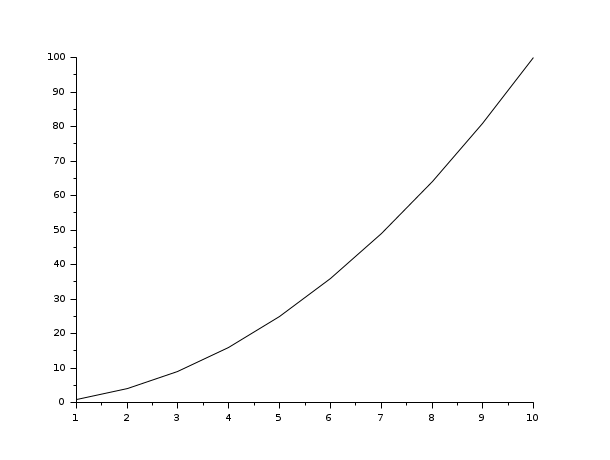
clf
fplot2d(1:10, 'parab')

参照
- plot2d — 2Dプロット
- feval — 関数(または外部ルーチン)を評価する
- paramfplot2d — 関数で定義された曲線の2次元アニメーションプロット
履歴
| バージョン | 記述 |
| 6.1.1 | fplot2d() is declared obsolete, to be removed from 6.2.x. plot(x,f) replaces it. |
| Report an issue | ||
| << fgrayplot | 2d_plot | grayplot >> |