Scilab-Branch-6.1-GIT
Please note that the recommended version of Scilab is 2026.1.0. This page might be outdated.
See the recommended documentation of this function
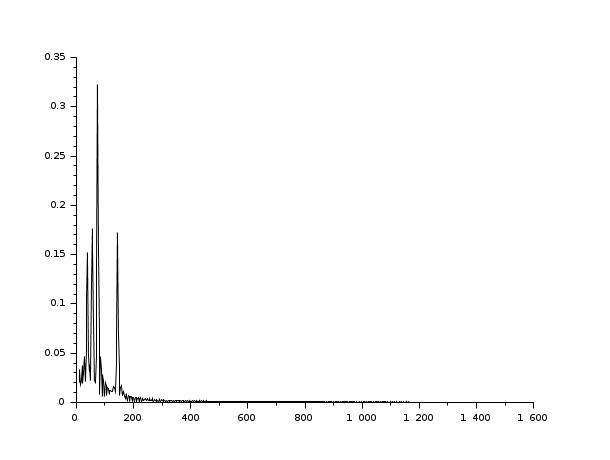
analyze
frequency plot of a sound signal
Arguments
- fmin,fmax,rate,points
scalars. default values fmin=100,fmax=1500,rate=22050,points=8192;
Description
Make a frequency plot of the signal w with sampling rate rate.
The data must be at least points long.
The maximal frequency plotted will be fmax, the minimal fmin.
Examples
// At first we create a time vector of 0.5 seconds sampled at 22050 Hz:
t = 0 : 1/22050 : 0.5*(1-%eps);

// Then we generate the sound.
s=sin(440*t)+sin(220*t)/2+sin(880*t)/2;
[nr,nc]=size(t);
s(nc/2:nc)=sin(330*t(nc/2:nc));
analyze(s);
| Report an issue | ||
| << Sons - fichiers audio | Sons - fichiers audio | auread >> |