Please note that the recommended version of Scilab is 2026.0.0. This page might be outdated.
See the recommended documentation of this function
xload
displays in a given window some graphical component loaded from a file.
Syntax
xload(file_name)
xload(file_name, win_num)
Arguments
- file_name
string: name of the binary file.
- win_num
integer: the id of the targetted graphic window. By default, the current graphics window is used.
Description
xload restores in the graphics window win_num
(or the current one) the graphics contained in the binary file file_name .
All saved uimenu or uicontrol are also restored.
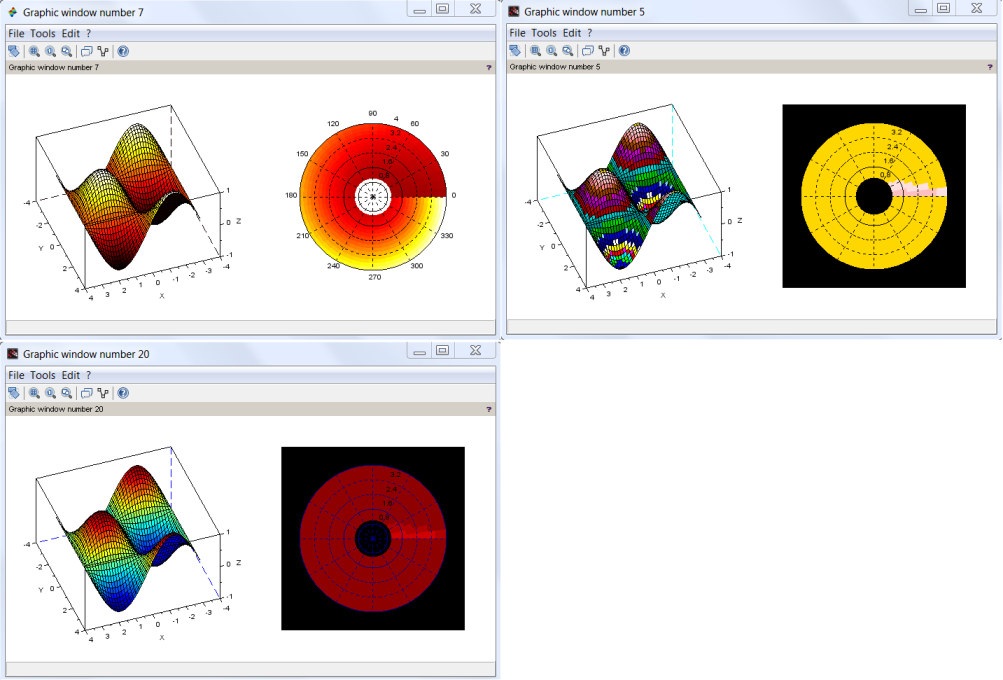
A loaded figure imposes its own properties, noticeably its colormap and axes_size, only if
- the target window is clear,
- and the forthcoming figure is the first graphical component to be loaded.
The (last) loaded component and its parent figure or/and axes become the current ones.
Comparing xload() versus load():
| load() behavior | xload() behavior | |
|---|---|---|
| In addition to the rendering of graphics... | the variables in the file are loaded in the environment, including the ones that are not graphic handles. They may overwrite existing variables not related to graphics. | the environment is kept free of any new variables. There is no overwriting hazard. |
| The file contains only one graphic, that is a figure. | It is displayed in a new graphic window, whose number n+1 increments the maximal existing figure's number n. | It is displayed in the current or given graphic window. |
| The file contains only one graphics, that is a component of a figure. | It is displayed in a new graphic window #n+1. | It is merged in the current or given graphic window. |
| The file contains several graphic figures or/and figures components. | They are all loaded. Each figure is displayed in a new dedicated graphic window. Other loaded components that are figures children are displayed in the (last) current figure, according to their loading order. | Only the last figure and the separate graphical components following it are displayed and merged in the current or given graphic window. |
 | When the file contains several variables being graphic handles or any other variables of any types, the loading order of variables (and so of related graphics) is the alphabetical order of the variables names. So, it is usually NOT the order the variables (among which the handles) have been listed in the save() statement! This may yield some unexpected results when several saved graphic handles have the same parent figure or are parent or children of each others, but with variables names whose alphabetical order does not match the order of their graphical hierarchy. |
Examples
path = TMPDIR+"/xload/";
mkdir(path);
graypolar = path + "graypolar.dat";
plotAxes  = path + "plotAxes.scg";
clf reset
subplot(1,2,1), plot3d()
plotA = gca();
save(plotAxes, "plotA"); // does not record the actual colormap used
                         // that is a figure's property, not an Axes one.
f = scf();
graypolarplot();        // imposes its colormap <> the default colormap
gca().axes_bounds = [0.5 0 0.5 1];  // puts the grayplot as subplot(1,2,2)
gcf().axes_size = [700 350];
save(graypolar, "f");   // records the actual colormap, as a figure's property

close(winsid())
xload(graypolar, 7) // The first restored element is a figure in a clean window
                    // => It imposes its colormap & axes_size.. to the figure
xload(plotAxes)

xload(plotAxes, 5) // => The default colormap is used
xload(graypolar)   // This loaded figure does not impose its own properties: too late!
gcf().axes_size = [700 350];

scf(20)
subplot(1,2,1), plot3d() // => The figure is no longer clear => its properties are now set.
xload(graypolar)         // This new figure does not impose its properties: too late!
gcf().axes_size = [700 350];

See also
History
| Version | Description |
| 5.0 | Saved uimenus and uicontrols are now restored as well. |
| Report an issue | ||
| << load_save | load_save | xsave >> |