Please note that the recommended version of Scilab is 2026.1.0. This page might be outdated.
See the recommended documentation of this function
axes properties
description of the axes entity properties
Description
The Axes entity is the second level of the graphics entities hierarchy. This entity defines the parameters allowing the change of coordinates and the axes drawing as well as the parameters' default values for the children creation.
- Axes properties
- parent:
This field contains the handle of the parent figure.
- children:
FA vector containing the handles of all graphics objects children of the axes These graphics objects are of type
"Compound","Rectangle","Polyline","Segs","Arc","Grayplot",.. (see Compound_properties, rectangle_properties, champ_properties, axis_properties, polyline_properties, segs_properties, grayplot_properties, surface_properties, fec_properties, text_properties, legend_properties)- visible:
This field contains the
visibleproperty value for axes . Its value should be"on"or"off". By default, axes is visible"on"in case all "visible" children are displayed on the screen, If"off"the axes and all its children are not drawn.- axes_visible:
A
1x3string vector. This property specifies whether each axis is drawn or not. Its value should be"on"or"off"for a global setting.To act on a single axis, the syntax isaxes_visible(N)whereNis1,2or3corresponding to thex,yorzaxis. The scaling data and if required the grids are drawn if the value is"on". Note that when creating a simple axes entity using thegca()(shortcut forget"current_axes")) orgcf()(shortcut forget(current_figure)) commands, the axes visibility is set to"off".- axes_reverse:
A
1x3string vector corresponding to the three axes (X,Y,Z). For each axes, the property specifies the direction of the increasing values. If"off", the default direction is used. If"on", the direction is reverse. It is also possible to use only one string,"on"or"off", to set simultaneously the three data.- grid:
vector of 3 colors indices
[xCol, yCol, zCol]used to draw the grid along respective directions. To cancel the grid in a direction, use-1as index. Default =[-1 -1 -1](no grid).- grid_style:
vector
[xLineStyle, yLineStyle, zLineStyle]of 2 or 3 line styles ids from 1 to 10 (solid, dashes, dots, etc) used to draw the grid along respective directions (in 2D or 3D). Available line styles are described there.- grid_thickness:
vector
[xLineThick, yLineThick, zLineThick]of 2 or 3 positive decimal numbers setting the thickness of the grid lines along respective directions (in 2D or 3D).- grid_position:
"background"(default): the grid is drawn behind all other graphical components ; or"foreground: the grid is drawn on the top.- x_location:
Specify the location of the x-axis. The possible values are:
"bottom". In this case the x axis is drawn at the bottom of the axes rectangle."top". In this case the x axis is drawn at the top of the axes rectangle."middle". In this case the x axis is drawn at the centered position."origin". In this case the x axis is drawn at the origin.
- y_location:
Specify the location of the y-axis. The possible values are:
"left". In this case the y axis is drawn at the left of the axes rectangle."right". In this case the y axis is drawn at the right of the axes rectangle."middle". In this case the y axis is drawn at the centered position."origin". In this case the y axis is drawn at the origin.
- title:
An object attached to the Axes entity and returning a graphic handle on a Label structure (see label_properties). This field defines a title with options on this label.
- x_label:
An object attached to the Axes entity and returning a graphic handle on a Label structure (see label_properties). This field defines a label on x axis with options on this label.
- y_label:
An object attached to the Axes entity and returning a graphic handle on a Label structure (see label_properties). This field defines a label on y axis with options on this label.
- z_label:
An object attached to the Axes entity and returning a graphic handle on a Label structure (see label_properties). This field defines a label on z axis with options on this label.
- auto_ticks:
Default
["on" "on" "on"]. auto_ticks status for each x, y and z respective axis."on"means that the axis is automatically graduated through a computational algorithm. Then, resizing the figure and axes automatically updates accordingly graduations ticks and labels of the given axis.On the contrary,
"off"means that graduations ticks or/and labels are set by hand. Then resizing the figure and axes has no effect on existing graduations ticks and labels.Setting
.auto_ticks="on"or"off"sets the same status for the x, y and z axes. Setting.auto_ticks(2)="off"sets the status only for the y axis. Etc. Editing ticks (labels and/or locations) via
x_ticks, y_ticksorz_ticksautomatically setsauto_ticksto"off"for the corresponding axes.- x_ticks, y_ticks, z_ticks:
Each of these properties is a tlist of type "ticks" with 2 fields named "locations" and "labels":
tlist(["ticks", "locations", "labels"], Locations, Labels)where- Locations
- is a real vector containing the locations of
graduations along and according to the data scale
of the given x or y or z axis.
When the number of ticks does not need to be changed,
their locations can be set or changed through
the syntax (e.g. along x)
Haxes.x_ticks.locations = LocationswhereHaxes = gca();andLocationsis the complete vector of updated ticks positions. To change just the ith location, just use:Haxes.x_ticks.locations(i) = newLoc - Labels
- is a text vector containing the labels to be displayed
in front of each related graduation. As for Locations
of ticks, Labels can be addressed with (e.g. along y)
Haxes.y_ticks.labels = LabelsorHaxes.y_ticks.labels(j) = newLabelJ.Vertical or tilted ticks labels can be yielded using LaTeX formating with
\rotatebox{angle}{text}. See the example below.
- For an axis,
LocationsandLabelsvectors must have the same number of components. - When the number of ticks must be changed, their positions
AND labels must be changed at once, in order to avoid
any mismatch: The syntax (e.g. along x)
Haxes.x_ticks = tlist(["ticks" "locations", "labels"], newLocations, newLabels)must then be used. - Changing by hand the
Locationsor/andLabelsof an axis automatically sets its.auto_ticksstatus to"off". This cancels its auto-regraduation under resizing of the figure.
- x_ticks.locations, y_ticks.locations, z_ticks.locations:
Each of these properties is a real vector containing the locations of graduations on the related x or y or z axis.
x_ticks.locationsmust have the same number of components asx_ticks.labels. Seex_tickshereabove for more details.- x_ticks.labels, y_ticks.labels, z_ticks.labels:
Each of these properties is a text vector containing the labels to be displayed in front of ticks on the related x or y or z axis.
x_ticks.labelsmust have the same number of components asx_ticks.locations. Seex_tickshereabove for more details.- ticks_format:
This property specifies the format to use for each axes. It is a row vector with at most 3 columns containing strings format (as specified for mprintf). Each ticks position will be used to format the string used as label.
So, for example ticks_format="%.2e" will print ticks positions in using scientific notation with two decimals.
Labels are actually updated according to the newly set.ticks_format(i)only if the.auto_ticks(i)status of the axis #i is"on". Otherwise,.ticks_format(i)is recorded without being immediately used.- ticks_st:
This property specifies scale-translate factors to apply to each ticks position before to use it in the formatted string used as label. So if the factors are
[x_s y_s z_s ; x_t y_t z_t]and if a x_tick is positioned at X, the value used to format the label will bex_s*(X-x_t). It could be particularly useful when the axes bounds are too closed.It is a matrix with 2 rows and at most 3 columns.
So, for example
base=B, labels could be printed withticks_format=string(base)+"%+.2e"andticks_st=[1 base]- box:
This property specifies whether to enclose the axes in a box. Its value can be either
"off","hidden_axes","back_half"or"on".If the property is"off", the box is not draw. If the property is"hidden_axes", only the back frame is drawn. If the property is"back_half", the X, Y and Z axis are also drawn. If the property is"on"the whole box is drawn.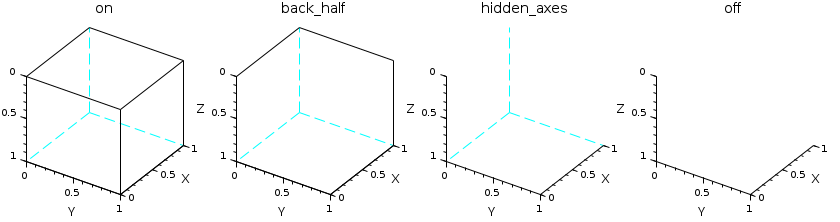
- filled:
This property specifies whether the axes background should be drawn or not. Its value can be either
"off"or"on".If the property is"off", the background is not drawn, the axes box is transparent. If the property is"on"the background is drawn using the color specified by thebackgroundproperty.- sub_ticks:
This field sets the number of tics to draw between two main tics. The field value is the vector
[nx,ny]wherenxis the number of sub tics for the x-axis andnyrespecting to the y-axis.- font_style:
Specifies the font used for displaying tics labels. This is a positive integer referencing one of the loaded fonts. Its value must be between 0, referencing the first font, and the number of loaded fonts minus one, referencing the last font. For more information see graphics_fonts.
- font_size:
It is a scalar specifying the character size of tics labels. If
fractional_fontproperty is"off"only the integer part of the value is used. For more information see graphics_fonts.- font_color:
This property determines the color of the tics labels.
- fractional_font:
This property specify whether ticks labels are displayed using fractional font sizes. Its value must be either
"on"or"off". If"on"the floating point value offont_sizeis used for display and the font is anti-aliased. If"off"only the integer part is used and the font is not smoothed.- isoview:
This property is used to have isometric scales on the x, y and z axes (for example to make the display of the curve sin(x) versus cos(x) be a circle not an ellipse). Its value should be
"on"or"off". If the value is"on", the axesdata_boundsautomatically change according to the corresponding figurefigure_sizeproperty values.- cube_scaling:
This property is used in
3d modeto have a rescaling of the x, y and z axes. Indeed, it allows thedatato fit into a 1x1x1 cube ; the goal is to better display 3d graphics in case axes scales are very different from one to another. Its value should be"on"or"off"(which is the default value). In most cases, it helps generating Matlab-like 3d view.- view:
This field is related to the graphics universe. It takes
"3d"as value corresponding to the three-dimensional views. In the other case its value can be"2d"for initial 2d plotting (default value). This flag also depends on the plots the user enters : aplot3dcommand, for example, will switch theviewflag from"2d"to"3d".- rotation_angles:
Spherical coordinates
[alpha, theta]=[polAngle, azimuth]of the observation point, in degrees:- theta: azimuth angle
in the (x,y) plane. Particular angles, for (x,y) seen
from (O,z):
270 : (O,x) to right 0 : (O,x) to bottom 90 : (O,x) to left 180 : (O,x) to top 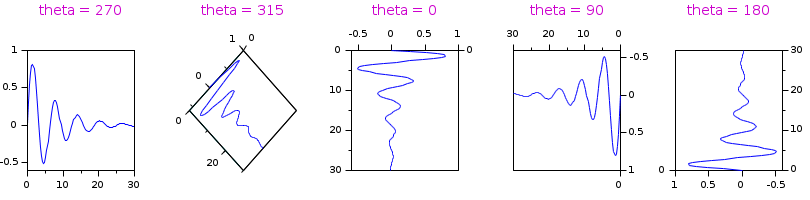
- alpha: polar angle from
(Oz), in planes orthogonal to (x,y). Particular values:
0 = North pole (O,z) view from above 90 = Equator (x,y) view from side 180 = South pole (O,-z) view from below 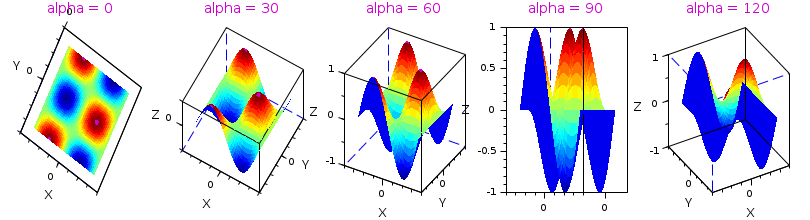
- theta: azimuth angle
in the (x,y) plane. Particular angles, for (x,y) seen
from (O,z):
- log_flags:
3 character string that sets the scale (linear or logarithmic) along the axes. Each character specifies the scale for respectively the X, Y and Z axes. They can be either
'n'for the normal scale, or'l'for the logarithmic one.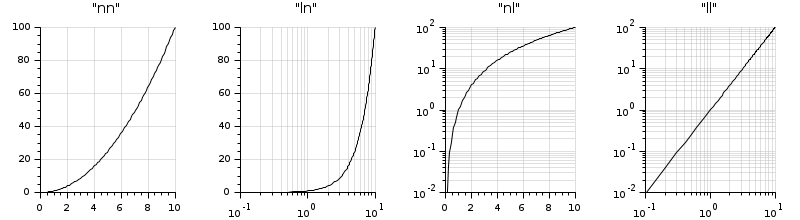
- tight_limits:
A
1x3string vector giving the tight_limits status for each axis. This property specifies whether each axis fits exactly with the minima and maxima values of the data bounds. If an item is"off", the corresponding axis may enlarge boundaries such as to produce pretty tics labels. For a global setting (all axes at once), you have to set its value to"on"or"off"(single string). To act on a single axis, the syntax istight_limits(N)whereNis1,2or3corresponding to thex,yorzaxis.- data_bounds:
This field contains the boundary values for the x, y and z coordinates. It is either the matrix or the vector
[xmin,ymin; xmax,ymax],[xmin,ymin,zmin; xmax,ymax,zmax],[xmin,xmax,ymin,ymax],[xmin,xmax,ymin,ymax,zmin,zmax],[xmin;xmax;ymin;ymax]or[xmin;xmax;ymin;ymax;zmin;zmax]. Note that, to strictly have the specified data bounds,tight_limitsmust be set to"on"value (see above). To manually set data_bounds setauto_scale="off"- zoom_box:
This field contains the current zoom box if any coordinates are given. It is an empty matrix (no zoom) or the vector
[xmin,ymin,xmax,ymax,zmin,zmax](defines a smaller axes box).- margins:
A vector
[margin_left,margin_right,margin_top,margin_bottom]specifying the margins portion for this axes. This vector is composed of numbers between [0 1] with default: [0.125 0.125 0.125 0.125]. These numbers are ratios relative to associated values of theaxes_boundsproperty, which arewidthformargin_leftandmargin_right, andheightformargin_topandmargin_bottom.- auto_margins:
A property to allow the automatic computation of the margins accordint to their contents. If value is
"on", then the automatic computation is activated.- axes_bounds:
Vector
[x_left, y_top, width, height]of four decimal numbers in [0, 1] specifying the portion of figure or frame used by this axes:x_leftandy_topset the position of the top-left corner of the axes area, with respect to the top-left corner of the embedding figure or frame.widthandheightset the dimensions of the axes area. 1 stands for the full width or height of the embedding figure or frame.
These numbers are relative to the
gca().parent.position(3:4)[width, height] dimensions of the figure or of the Uicontrol frame embedding the axes.- hidden_axis_color:
This property defined the color of the hidden axis. It takes an index relative to the current colormap.
- user_data:
This field can be use to store any scilab variable in the axes data structure, and to retrieve it.
- Properties for high level functions
The
plot,plot2dx,grayplotandmatplotfunctions use the following properties to decide how to merge consecutive plots if this is not stated by theframeflagcalling argument. The result of the merge is decided through these two following properties:- auto_clear:
"on": a call to a high level graphic function targeting the axes- erases all children of the axes,
- resets its
.log_flagsand.data_boundsproperties to their default value - keeps its other properties
"off": the forthcoming drawings are overplotted in the axes according to the"auto_scale"rule and other properties.- auto_scale:
Property enabling the auto update of
.data_bounds."on": Each new plot enlarges.data_boundsvalues according to boundaries of added data."off": Default or explicitly initialized values of.data_boundsare not modified.
- Children's default values:
- hiddencolor:
This property controls the hidden parts' color. It takes as value an index relative to the current colormap. In another case, if it is a negative value, the hidden parts take the same colors as the surface
- line_mode:
This field contains the default
line_modeproperty value for Segs Rectangle Legend Axis Plot3d Fac3d and Polyline objects. Its value should be"on"(default) or"off".- line_style:
This field contains the default
line_styleproperty value for Segs, Arcs, Rectangle and Polyline objects.line_styleselects the type of line to be used to draw lines . Its value should be an integer in [1 10]. 1 stand for solid, the other values stand for a selection of dashes (dash, dash dot, longdash dot, bigdash dot, bigdash longdash, dot, double dot, longblank dot, bigblank dot).- thickness:
This field contains the default
thicknessproperty value for all objects using line drawing. It is a positive real specifying the line width in pixels. The displayed width is actually determined by rounding the supplied width to the nearest integer. The only exception is vectorial export where the wholethicknessvalue is considered.- mark_mode:
This field contains the default
mark_modeproperty value for Segs Rectangle Legend Axis Plot3d Fac3d and Polyline objects. Its value should be"on"or"off"(default).- mark_style:
This field contains the default
mark_styleproperty value for Segs Rectangle Legend Axis Plot3d Fac3d and Polyline objects.mark_styleselects the type of mark to be displayed. Its value should be an integer in [0 9] which stands for: dot, plus, cross, star, filled diamond, diamond, triangle up, triangle down, trefle and circle.- mark_size_unit:
This field contains the default
mark_size_unitproperty value for Segs Rectangle Legend Axis Plot3d Fac3d and Polyline objects. Ifmark_size_unitis set to"point", then themark_sizevalue is directly given in points. Whenmark_size_unitis set to"tabulated",mark_sizeis computed relative to the font size array: therefore, its value should be an integer in [0 5] which stands for 8pt, 10pt, 12pt, 14pt, 18pt and 24pt. Note that plot2d and pure scilab functions usetabulatedmode as default ; when using plot function, thepointmode is automatically enabled.- mark_size:
This field contains the default
mark_sizeproperty value for Segs Rectangle Legend Axis Plot3d Fac3d and Polyline objects.mark_sizeselects the font size of mark to be displayed. Its value should be an integer in [0 5] which stands for 8pt, 10pt, 12pt, 14pt, 18pt and 24pt.In the special case where mark_style and mark_size are 0, a dot of one pixel is drawn.- mark_foreground:
This field contains the default
mark_foregroundproperty value for all objects created under this axes. Polyline, rectangle, legend, surface, segment and axis objects are using this property to specify a foreground (edge) color for their marks. Its value should be a color index (relative to the current color_map) or 0 for transparent edge. Note that the default value is-1(default black) and, even if you change thecolor_map, this-1value will always point onto the default black color.- mark_background:
This property controls the default
mark_backgroundproperty value for all objects created under this axes. Polyline, rectangle, legend, surface, segment and axis objects are using this property to specify a background (face) color for their marks. It takes as value an index relative to the current colormap or 0 for transparent face. Note that the default value is-2(default white) and, even if you change thecolor_map, this-2value will always point onto the default white color.- foreground:
This field contains the default
foregroundproperty value for axes and all objects created under this axes. Its value should be a color index (relative to the current color_map). Note that the default value is-1(default black) and, even if you change thecolor_map, this-1value will always point onto the default black color.- background:
This property controls the default
backgroundproperty value for axes and all objects created under this axes. It takes as value an index relative to the current colormap.Note that the default value is-2(default white) and, even if you change thecolor_map, this-2value will always point onto the default white color.- arc_drawing_mode:
This property controls the default
arc_drawing_modeproperty value for all created Arc objects under this Axes object. Its value should be either"nurbs"or"lines".- clip_state:
This field contains the default
clip_stateproperty value for all objects. Its value should be :"off"this means that all objects created after that are not clipped (default value)."clipgrf"this means that all objects created after that are clipped outside the Axes boundaries."on"this means that all objects created after that are clipped outside the rectangle given by property clip_box.
- clip_box:
This field contains the default
clip_boxproperty value for all objects. Its value should be an empty matrix if clip_state is"off". Other case the clipping is given by the vector[x,y,w,h](upper-left point width height).- Note on default values :
All these listed properties and fields inherit from default values stored in an axes model. These default values can be seen and changed. To do so, use the
get("default_axes")command : it returns a graphic handle on the axes model. Note that no graphic window is created by this command. The next created axes will inherit from this model (see "Example on axes model" below).
Examples
lines(0) // disables vertical paging
a=get("current_axes")//get the handle of the newly created axes
a.axes_visible="on"; // makes the axes visible
a.font_size=3; //set the tics label font size
a.x_location="top"; //set the x axis position
a.data_bounds=[-100,-2,-1;100,2,1]; //set the boundary values for the x, y and z coordinates.
a.sub_tics=[5,0];
a.labels_font_color=5;
a.grid=[2,2];
a.box="off";

// Example with 3D axes
clf(); //clear the graphics window
x=0.1:0.1:2*%pi;plot2d(x-.3,sin(x)*7+.2);
a=gca(); // get the handle of the current axes
a.grid=[1 -1 -1]; //make x-grid
a.rotation_angles=[70 250]; //turn the axes with giving angles
a.grid=[1 6 -1]; //make y-grid
a.view="2d"; //return te the 2d view
a.box="back_half";
a.labels_font_color=5;
a.children.children.thickness=4;
a.children.children.polyline_style=3;
a.view="3d"; //return te the 3d view
a.children.children.thickness=1;
a.children.children.foreground=2;
a.grid=[1 6 3]; //make z-grid
a.parent.background=4;
a.background=7;
plot2d(cos(x)+1,3*sin(x)-3);
plot2d(cos(x)+7,3*sin(x)+3);
a.children(2).children.polyline_style=2;
a.children(1).children.polyline_style=4;
a.children(1).children.foreground=5;
a.children(2).children.foreground=14;
a.parent.figure_size= [1200,800];
a.box="on";
a.labels_font_size=4;
a.parent.background=8;
a.parent.figure_size= [400,200];
a.rotation_angles=[0 260];
delete(a.children(2));
delete(); // delete current object

a = gca();
a.labels_font_size=1;
a.auto_clear= "on";
x=0:0.1:2.5*%pi;plot2d(10*cos(x),sin(x));

a.data_bounds(:,1) = [1;15] ; // set positive bounds for X axe
a.log_flags = "lnn" ; // set X axes to logarithmic scale
a.log_flags = "nnn" ; // switch back to linear scale

a=gca();
a.rotation_angles=[45 45];
a.data_bounds=[-20,-3,-2;20 3 ,2];
xrect([-4 0.5 8 1]);
a.auto_clear = "off" ;
a.isoview="on"; // isoview mode
xrect([-2 0.25 4 0.5]);
a.children(1).fill_mode="on";
a.axes_visible="off";
a.children(1).data=[-2 0.25 -1 4 0.5];
a.children(2).data=[-4 0.5 1 8 1];
x=2*%pi*(0:7)/8;
xv=[.2*sin(x);.9*sin(x)];yv=[.2*cos(x);.9*cos(x)];
xsegs(10*xv,yv,1:8)
s=a.children(1);
s.arrow_size=1;
s.segs_color=5;
a.data_bounds //the boundary values for the x,y and z coordinates
a.view="2d";
a.data_bounds=[-10,-1; 10,1]; // set the boundary values for the two-dimensional views

// Example on axes model
da=gda() // get the handle on axes model to view and edit the fields
// title by default
da.title.text="My Default@Title"
da.title.foreground = 12;
da.title.font_size = 4;
// x labels default
da.x_label.text="x";
da.x_label.text="x"; // Latex or MathML can be used here also
da.x_label.font_style = 8;
da.x_label.font_size = 2;
da.x_label.foreground = 5;
da.x_location = "middle";
// y labels default
da.y_label.text="y";
da.y_label.font_style = 3;
da.y_label.font_size = 5;
da.y_label.foreground = 3;
da.y_location = "right";
da.thickness = 2;
da.foreground = 7;
// the plot
x=(0:0.1:2*%pi)';
plot2d(x,[sin(x),sin(2*x),sin(3*x)],style=[1,2,3],rect=[0,-2,2*%pi,2]);
sda() // back to default axes model

// Example with LaTeX / MathML ticks:
plot2d();
a=gca();

mathml = "<mrow><mfrac><mrow><mi>d</mi>  <mi>y</mi></mrow><mrow>  <mi>d</mi>  <mi>x</mi></mrow></mfrac> <mo>=</mo>" + ...
    "<mfrac><mn>1</mn><msup> <mi>y</mi>  <mn>2</mn></msup> </mfrac> </mrow>";
// Only LaTeX expression
a.x_ticks = tlist(["ticks", "locations", "labels"], (0:6)', [mathml;"1";"$\sin(x)$";"3";"$\cos(a) - test$";"5";"6"]);

// Mixed expression: MathML and LaTex
a.y_ticks = tlist(["ticks", "locations", "labels"], (-2:0.5:2)', ["0";"1";"2";"3";"$\cos(a)$";"5";"6";mathml;"8"]);
m = [66.425514; 66.425513];
plot([69;70], m);
a = gca();
a.ticks_format = ["" sprintf("%.2f", m(2))+"%+.1e"];
a.ticks_st = [1 1;0 m(2)];
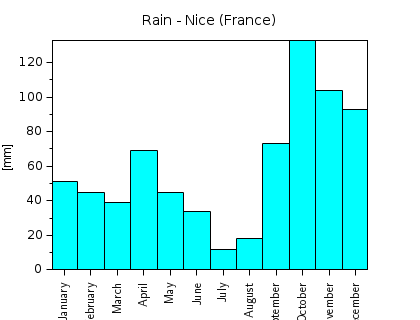
Example with vertical x_ticks labels:
rain_Nice  = [51  45  39 69 45 34 12 18 73 133 104 93 ];
months = _(["January" "February" "March" "April" "May" "June" "July" ...
            "August" "September" "October" "November" "December"]);
clf
bar(rain_Nice,1,"cyan");
title(_("Rain - Nice (France)"), "fontsize",3)
ylabel("[mm]")
gca().x_ticks.labels = "$\rotatebox{90}{\mathsf{"+months'+"}}$";
set(gca(), "tight_limits", "on", "font_size", 2);
gcf().axes_size = [460 320];
See also
- axis_properties — description of the axis entity properties
- drawaxis — draw an axis
- set — set properties of some graphic objects or uimenus or uicontrol interactive components
- get — Gets the handle of a graphical or User Interface object, or the property's value of objects.
- gca — Return handle of current axes.
- gda — Return handle of default axes.
- sda — reSets the Default Axes to its factory values
- polyline_properties — description of the Polyline entity properties
- graphics_entities — description of the graphics entities data structures
History
| Version | Description |
| 5.4.0 | .line_style value 0 is replaced with 1 (for solid line). |
| 5.5.0 |
|
| 5.5.2 | .tight_limits property can now manage X, Y and Z axis separately. |
| 6.1.0 | Default .grid_style is now [7 7] instead of [3 3]. |
| 6.1.1 | Default .x|y|z_label.font_size=2, instead of 1. Default .title.font_size=3, instead of 1. |
| Report an issue | ||
| << axes_operations | axes_operations | gca >> |