- Scilab Help
- Graphics
- 2d_plot
- LineSpec
- Matplot
- Matplot1
- Matplot properties
- Sfgrayplot
- Sgrayplot
- champ
- champ1
- champ properties
- comet
- contour2d
- contour2di
- contour2dm
- contourf
- errbar
- fchamp
- fec
- fec properties
- fgrayplot
- fplot2d
- grayplot
- grayplot properties
- graypolarplot
- histplot
- paramfplot2d
- plot
- plot2d
- plot2d2
- plot2d3
- plot2d4
- plotimplicit
- polarplot
- scatter
Please note that the recommended version of Scilab is 2026.1.0. This page might be outdated.
See the recommended documentation of this function
contour2d
level curves of a surface on a 2D plot
Syntax
contour2d(x, y, z, nz, [style, strf, leg, rect, nax])
contour2d(x, y, z, nz, <opt_args>)
Arguments
- x, y
two real row vectors of size
n1andn2: the grid.- z
real matrix of size
(n1,n2), the values of the function on the grid or a Scilab function which defines the surfacez=f(x,y).- nz
the level values or the number of levels.
- If
nzis an integer its value gives the number of level curves equally spaced from
zmintozmaxas follows:z= zmin + (1:nz)*(zmax-zmin)/(nz+1)
 Note that the
zminandzmaxlevels are not drawn (generically they are reduced to points) but they can be added with- If
nzis a vector nz(i)gives the value of thei-th level curve.
- If
- <opt_args>
This represents a sequence of statements
key1=value1,
                key2=value2
,... wherekey1,key2,... can be one of the following:style,leg,rect,nax,strforaxesflagandframeflag(see plot2d)- style, strf, leg, rect, nax
see plot2d. The argument
stylegives the dash styles or colors which are to be used for level curves. It must have the same size as the number of levels.
Description
contour2d draws level curves of a surface
z=f(x,y) on a 2D plot. The values of
f(x,y) are given by the matrix
z at the grid points defined by
x and y.
You can change the format of the floating point number printed on
the levels by using xset("fpf",string) where
string gives the format in C format syntax (for
example string="%.3f"). Use string="" to
switch back to default format and use string=" " to
suppress printing. This last feature is useful in conjunction with
legends to display the level numbers
in a legend and not directly onto the level curves as usual (see
Examples).
The optional arguments style,
strf, leg,
rect, nax can be
passed by a sequence of statements key1=value1,
key2=value2
,... where keys may be
style, strf,
leg, rect,
nax. In this case, the order has no special meaning.
Use contour to draw levels curves on a 3D surface.
Examples
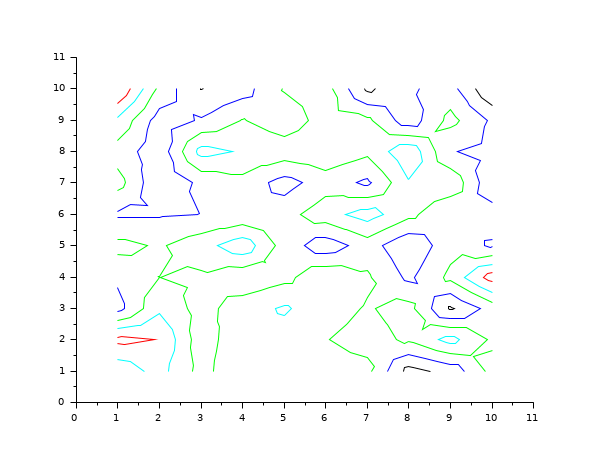
contour2d(1:10,1:10,rand(10,10),5,rect=[0,0,11,11])
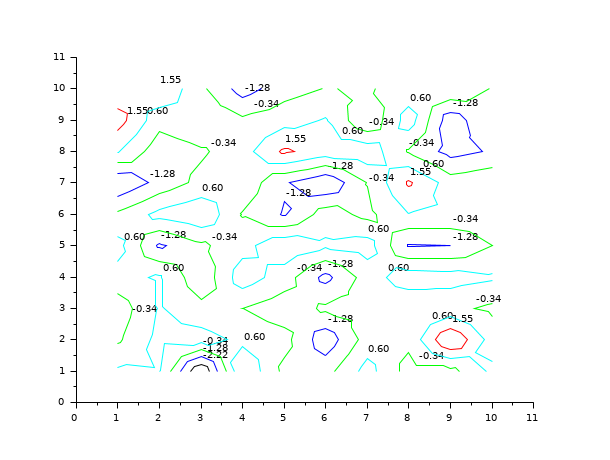
clf()
// changing the format of the printing of the levels
xset("fpf","%.2f")
contour2d(1:10,1:10,rand(10,10),5,rect=[0,0,11,11])
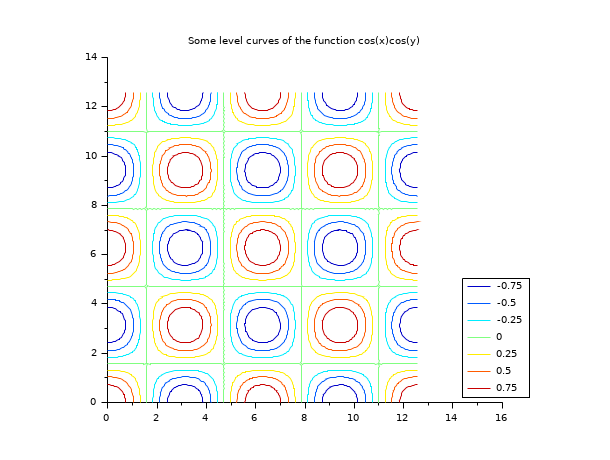
// now an example with level numbers drawn in a legend
// Caution there are a number of tricks...
x = linspace(0,4*%pi,80);
z = cos(x')*cos(x);
clf(); f=gcf();
xset("fpf"," ")
// trick 1: this implies that the level numbers are not
//          drawn on the level curves
f.color_map=jetcolormap(7);
// trick 2: to be able to put the legend on the right without
//          interfering with the level curves use rect with a xmax
//          value large enough
contour2d(x,x,z,-0.75:0.25:0.75,frameflag=3,rect=[0,0,5*%pi,4*%pi])
// trick 3: use legends (note that the more practical legend function
//          will not work as soon as one of the level is formed by 2 curves)
legends(string(-0.75:0.25:0.75),1:7,"lr");
xtitle("Some level curves of the function cos(x)cos(y)")
See also
- contour — level curves on a 3D surface
- contour2di — compute level curves of a surface on a 2D plot
- contour2dm — compute level curves of a surface defined with a mesh
- plot2d — 2D plot
| Report an issue | ||
| << comet | 2d_plot | contour2di >> |