Please note that the recommended version of Scilab is 2026.1.0. This page might be outdated.
See the recommended documentation of this function
xtitle
グラフィックスウインドにタイトルを追加する
呼び出し手順
xtitle(title,[x_label,[y_label,[z_label]]],<opts_args>)
引数
- title,x_label,y_label, z_label
文字列の行列.
Scilab 5.2以降, LaTeX または MathML 式 を指定することができます.
- <opt_args>
一連の命令
key1=value1,
                            key2=value2
,... ,ただし, キーにはboxedとすることが できます(下記参照). この場合, 順番に特別な意味はありません.- boxed
整数値. 1の場合, 各タイトルの周囲にボックスが 描画されます.
説明
xtitle は 2D または 3D プロットに
タイトルを追加します.
titleは一般的なタイトルで,
x_label,
y_label および
z_label は
3軸のタイトルです.
引数が行列の場合,行列の各行が異なる線上に表示されます.
デモを参照には,コマンド xtitle() と入力してください.
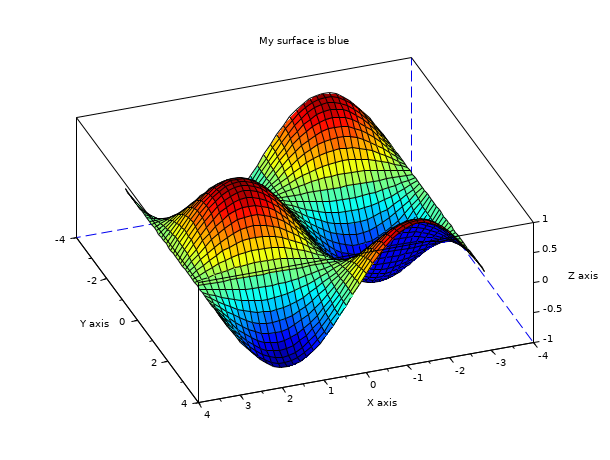
例
plot3d() ;
// タイトルを描画
xtitle( 'My surface is blue', 'X axis', 'Y axis', 'Z axis' ) ;
// タイトルの周囲にボックスを描画
xtitle( 'My surface is blue', 'X axis', 'Y axis', 'Z axis', boxed = %t );

//  LaTeX & MathMLで指定:
mathml="<mrow>      <mfrac>        <mrow>          <mi>d</mi>          <mi>y</mi>        </mrow>        <mrow>          <mi>d</mi>          <mi>x</mi>        </mrow>      </mfrac>      <mo>=</mo>      <mfrac>        <mn>1</mn>        <msup>          <mi>y</mi>          <mn>2</mn>        </msup>      </mfrac>    </mrow>";

xtitle( 'My surface is blue', 'X axis', '$Y axis$', mathml );
参考
- titlepage — グラフィックウインドウの中央にタイトルを追加する
- label_properties — Labelエンティティプロパティの説明
| Report an issue | ||
| << xlabel | annotation | axes_operations >> |