Scilab 6.0.2
Please note that the recommended version of Scilab is 2026.1.0. This page might be outdated.
See the recommended documentation of this function
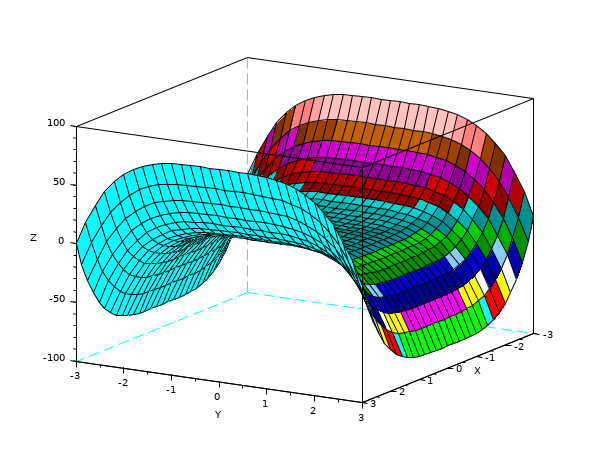
fplot3d1
関数により定義された曲面の3次元グレーまたは カラーレベルプロット
呼び出し手順
fplot3d1(xr,yr,f,[theta,alpha,leg,flag,ebox])

fplot3d1(xr,yr,f,<opt_args>)
引数
- xr
大きさn1の行ベクトル.
- yr
大きさn2の行ベクトル.
- f
z=f(x,y)型の外部ルーチン.
- theta,alpha,leg,flag,ebox
plot3d1参照.- <opt_args>
plot3d参照.
説明
fplot3d1 は外部関数f
によりxr および yr
で定義されるグリッド上で定義される曲面の3次元グレーまたは
カラーレベルプロットをプロットします.
コマンド fplot3d1()を入力すると,デモが表示されます.
参照
- plot3d1 — 曲面の3次元白黒またはカラープロット
| Report an issue | ||
| << fplot3d | 3d_plot | genfac3d >> |