Please note that the recommended version of Scilab is 2026.1.0. This page might be outdated.
See the recommended documentation of this function
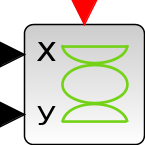
CSCOPXY
y = f(x) permanent viewer
Block Screenshot
Contents
Description
This block realizes the visualization of the evolution of the two regular inputs signals by drawing the second input as a function of the first at instants of events on the event input port. When a point is drawn on screen it stays until the simulation is finished.
Parameters
Number of Curves
Set the number of curves. Properties : Type 'vec' of size 1
color
an integer. It is the color number (≥ 0) or marker type (< 0) used to draw the evolution of the input port signal. Seeplot2d for color (dash type) definitions.
Properties : Type 'vec' of size 1
line or mark size
an integer.
Properties : Type 'vec' of size 1
Output window number
The number of graphic window used for the display. It is often good to use high values to avoid conflict with palettes and Super Block windows. If you have more than one scope, make sure they do not have the same window numbers (unless superposition of the curves is desired).
Properties : Type 'vec' of size 1
Output window position
a 2 vector specifying the coordinates of the upper left corner of the graphic window. Answer [] for default window position.
Properties : Type 'vec' of size -1
Output window sizes
a 2 vector specifying the width and height of the graphic window. Answer [] for default window dimensions.
Properties : Type 'vec' of size -1
Xmin
Minimum values of the first input; used to set up the X-axis of the plot in the graphics window.
Properties : Type '' of size
Xmax
Maximum values of the first input; used to set up the X-axis of the plot in the graphics window.
Properties : Type 'vec' of size 1
Ymin
Minimum values of the second input; used to set up the Y-axis of the plot in the graphics window.
Properties : Type 'vec' of size 1
Ymax
Maximum values of the second input; used to set up the Y-axis of the plot in the graphics window.
Properties : Type 'vec' of size 1
Buffer size
To improve efficiency it is possible to buffer the input data. The drawing is only done after each Buffer size call to the block.
Properties : Type 'vec' of size 1
Default properties
always active: no
direct-feedthrough: no
zero-crossing: no
mode: no
regular inputs:
- port 1 : size [1,1] / type 1
- port 2 : size [1,1] / type 1
number/sizes of activation inputs: 1
number/sizes of activation outputs: 0
continuous-time state: no
discrete-time state: no
object discrete-time state: no
name of computational function: cscopxy
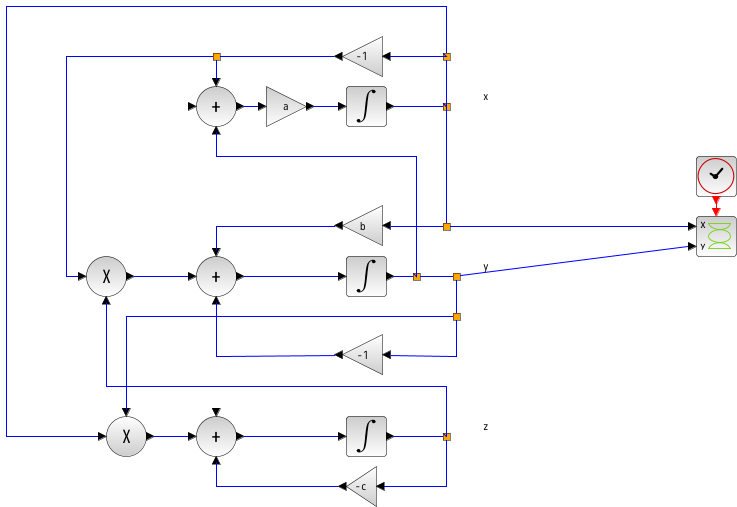
Example
Interfacing function
SCI/modules/scicos_blocks/macros/Sinks/CSCOPXY.sci
Computational function
SCI/modules/scicos_blocks/src/c/cscopxy.c (Type 4)
See also
| Report an issue | ||
| << CSCOPE | Sinks palette | CSCOPXY3D >> |