Please note that the recommended version of Scilab is 2026.1.0. This page might be outdated.
See the recommended documentation of this function
CMSCOPE
Multi display scope in subplot(N,1)
Block Screenshot
Contents
Description
When you start a simulation, Xcos open Scope windows. The Scope block displays its input with respect to simulation time. The Scope block can have multiple axes (one per port); all axes have a common time range with independent y-axes. The Scope allows you to adjust the amount of time and the range of input values displayed.
Parameters
Input ports sizes
It allows multiple input ports.
Properties : Type 'vec' of size -1
Drawing colors
a vector of integers. The i-th element is the color number (≥ 0) or marker type (< 0) used to draw the evolution of the i-th input port signal. Seeplot2d for color (dash type) definitions.
Properties : Type 'vec' of size -1
Output window number
The number of graphic window used for the display. It is often good to use high values to avoid conflict with palettes and Super Block windows. If default value is used(1) , Xcos define the output window number.
Properties : Type 'vec' of size 1
Output window position
a 2 vector specifying the coordinates of the upper left corner of the graphic window. Answer [] for default window position.
Properties : Type 'vec' of size -1
Output window sizes
a 2 vector specifying the coordinates of the upper left corner of the graphic window. Answer [] for default window position.
Properties : Type 'vec' of size size -1
Ymin vector
Minimum values of the input; used to set up the Y-axis of the plot in the graphics window.
Properties : Type 'vec' of size size(%1,'*')
Ymax vector
Maximum values of the input; used to set up the Y-axis of the plot in the graphics window.
Properties : Type 'vec' of size size(%1,'*')
Refresh period
Maximum value on the X-axis (time). The plot is redrawn when time reaches a multiple of this value.
Properties : Type 'vec' of size size(%1,'*')
Buffer size
To improve efficiency it is possible to buffer the input data. The drawing is only done after eachBuffer size call to the block.
Properties : Type 'vec' of size 1
Accept herited events 0/1
if 0CSCOPE_f draws a new point only when an event occurs on its event input port. if 1CSCOPE_f draws a new point when an event occurs on its event input port and when it's regular input changes due to an event on an other upstream block (herited events).
Properties : Type 'vec' of size 1
Name of Scope
Name/label of the block.
Properties : Type 'str' of size 1
Default properties
always active: no
direct-feedthrough: yes
zero-crossing: no
mode: no
regular inputs:
- port 1 : size [1,1] / type 1
- port 2 : size [1,1] / type 1
number/sizes of activation inputs: 1
number/sizes of activation outputs: 0
continuous-time state: no
discrete-time state: no
object discrete-time state: no
name of computational function: cmscope
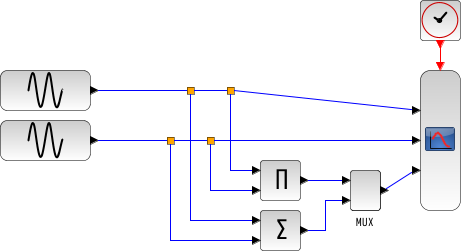
Example
Interfacing function
SCI/modules/scicos_blocks/macros/Sinks/CMSCOPE.sci
Computational function
SCI/modules/scicos_blocks/src/c/cmscope.c (Type 4)
See also
| Report an issue | ||
| << CMATVIEW | Sinks palette | CSCOPE >> |