Scilab 6.0.2
Please note that the recommended version of Scilab is 2026.1.0. This page might be outdated.
See the recommended documentation of this function
show_margins
display gain and phase margin and associated crossover frequencies
Syntax
show_margins(h)
show_margins(h,'bode')
show_margins(h,'nyquist')
Arguments
- h
a SISO linear system (see :syslin).
Description
Given a SISO linear system in continuous or discrete time,
show_margins display gain and phase margin and
associated crossover frequencies on a bode (the defaut) or nyquist
representation of the frequency response of the system.
Examples
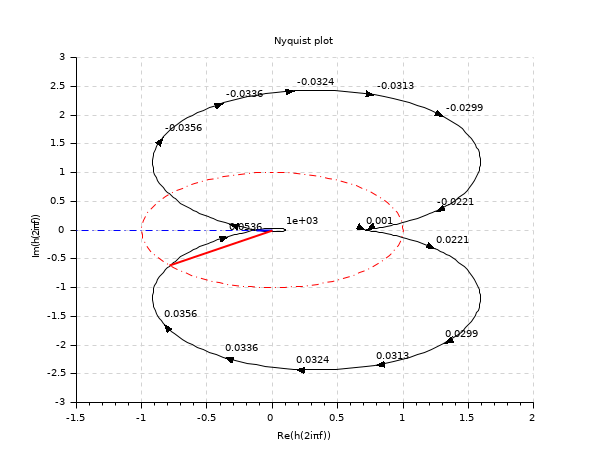
//continuous case
h=syslin('c',0.02909+0.11827*%s+0.12823*%s^2+0.35659*%s^3+0.256*%s^4+0.1*%s^5,..
             0.0409+0.1827*%s+1.28225*%s^2+3.1909*%s^3+2.56*%s^4+%s^5);
show_margins(h)
show_margins(h,'nyquist')
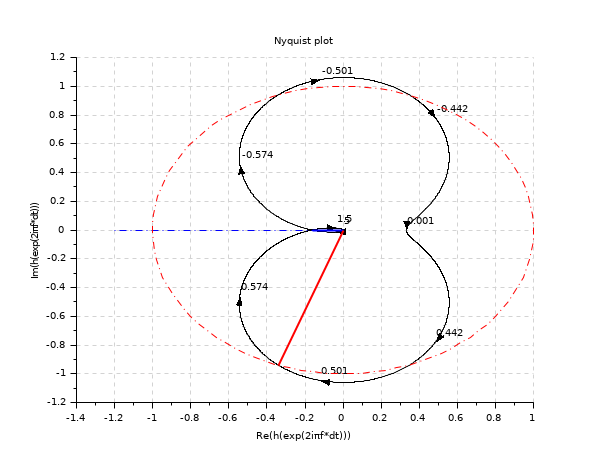
//discrete case
h = syslin(0.1,0.01547+0.01599*%z ,%z^2-1.81*%z+0.9048)
show_margins(h)
show_margins(h,'nyquist')
See also
| Report an issue | ||
| << sgrid | Stability | st_ility >> |