Please note that the recommended version of Scilab is 2026.1.0. This page might be outdated.
See the recommended documentation of this function
replot
reframes with new boundaries the current or a given set of axes
Syntax
replot()
replot(area)
replot(idAxes)
replot(area, idAxes)
replot(.., tight_limits)
Arguments
- area
matrix
[xmin xmax ; ymin ymax]or[xmin xmax ; ymin ymax ; zmin zmax], or row[xmin ymin xmax ymax]or[xmin ymin zmin xmax ymax zmax]: new bounds of the area to be reframed.
The default area is [%inf %inf %inf %inf] for a 2D axes, or [%inf %inf %inf %inf %inf %inf] for a 3D one.
%nancan be used to keep a bound as is.%infcan be used to set a bound to the position of the most marginal graphical component existing in the axes, for the considered direction.
If N axes are identified in
idAxes,areamay be a matrix with N rows and 4 or 6 columns. The row #i is then related to the axes #i ofidAxes. Ifareais only a vector of 4 or 6 bounds, these ones are used for all axes to be reframed.- idAxes
Vector of graphic handles, expected to be of Axes type or to have direct children of type Axes, such as Figures or some frame uicontrols.
idAxesspecifies direct or children Axes to crop. If no axes is found, nothing is done.By default, the current Axes is considered.
- tight_limits
Single word
"tight"or"on"or"off", or vector of 2 (in 2D) or 3 (in 3D) words"tight"or"on"or"off". If a single word is provided, it is used for every axis. This option forces the.tight_limitsattribute of considered axes to the specified"on"or"off"values. By default, current limits modes are unchanged.
Description
replot is used to reframe the (set of) axes specified
with idAxes -- or by default the current axes --
with new boundaries defined in 2D by
[xmin xmax ; ymin ymax] or
[xmin xmax ; ymin ymax ; zmin zmax],
or in 3D by
[xmin ymin xmax ymax] or
[xmin ymin zmin xmax ymax zmax].
It changes the data_bounds attribute of processed axes.
When a specified bound is infinite (%inf and -%inf are equivalent),
replot looks for the most marginal graphical object
and sets the actual related bound to its position, taking also
objects sizes into account. This ensures not clipping any object
that would be beyond the targeted side of the axes.
When the tight_limits option is provided,
its value is assigned to the .tight_limits
attribute of each considered axes, in an axis-wise way.
Examples
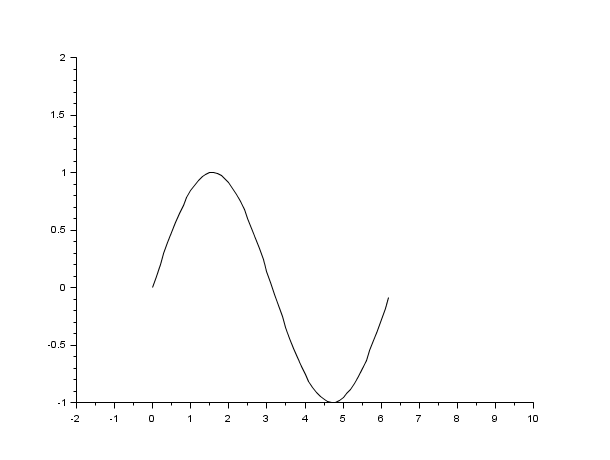
xdel(winsid());
plot() // plot demo
f = gcf();
replot([-1,-1,10,2],f.children(1)) // specify axes handle's value
replot([-3,-2,8,4],f.children(2))
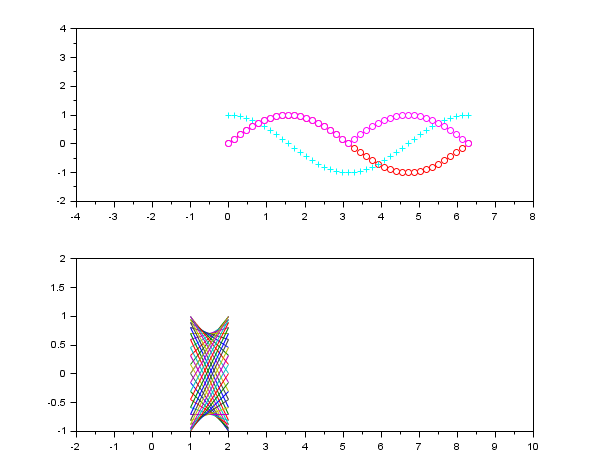
// Leaving some bounds as is with %nan:
x = linspace(0,360,200).';
clf
plot2d(x,[sind(x) tand(x)])
ax = gca();
ax.data_bounds              // initial bounds
replot([%nan,-10,%nan,10])  // only Ymin and Ymax are changed
ax.data_bounds              // updated bounds
See also
- zoom_rect — zoom a selection of the current graphic figure
- rubberbox — растягиваемая рамка для прямоугольного выделения
- axes_properties — description of the axes entity properties
History
| Version | Description |
| 5.5.0 |
|
| 6.0 |
|
| Report an issue | ||
| << plotframe | axes_operations | rotate_axes >> |