Please note that the recommended version of Scilab is 2026.1.0. This page might be outdated.
See the recommended documentation of this function
xlabel
x軸ラベルを付加する
ylabel
y軸ラベルを付加する
zlabel
z軸ラベルを付加する
呼び出し手順
xlabel([axes_handle], label, [property_name, property_value,...])
ylabel([axes_handle], label, [property_name, property_value,...])
zlabel([axes_handle], label, [property_name, property_value,...])
引数
- label
文字列, ラベルの値を有する
- axes_handle
オプションのハンドルで, ラベルを設定する軸を指定します.
- [property_name, property_value,...]
オプションの名前-値の組の並びで, (ここに記述されたtextプロパティに関係する) ラベルのtextプロパティを指定します.
利用可能なx-y-zラベルのプロパティを以下に示します:
"visible":"on"または"off""fontsize", "font_size": フォントの大きさ (定数)"fontname", "font_style": 利用可能な10種類のフォント名 (大文字小文字を区別しない文字列または関係するid番号): "courrier" | 0, "symbol" | 1, "times" | 2, "times italic" | 3, "times bold" | 4, "times bold italic" | 5, "helvetica" | 6, "helvetica italic" | 7, "helvetica bold" | 8, "helvetica bold italic" | 9."rotation", "font_angle": 角度 (単位:deg) (定数)"position": ラベルの位置 (2次元ベクトル)"color", "font_foreground": フォントの色 (["red","green","blue","cyan","magenta","yellow", "black","white"],または RGB行列の値から選んだ文字列の値)"edgecolor", "foreground": テキスト周囲の線の色 (["red","green","blue","cyan","magenta","yellow", "black","white"],または RGB行列の値から選んだ文字列の値)"backgroundcolor", "background": テキスト周囲の背景色 (["red","green","blue","cyan","magenta","yellow", "black","white"],または RGB行列の値から選んだ文字列の値)
説明
xlabel, ylabel, zlabel は,それぞれ,x, y, およびz軸に ラベルを付けるために使用します.
このラベルは2次元プロットでは対応する軸の下, 3次元プロットでは軸の横または下に表示されます.
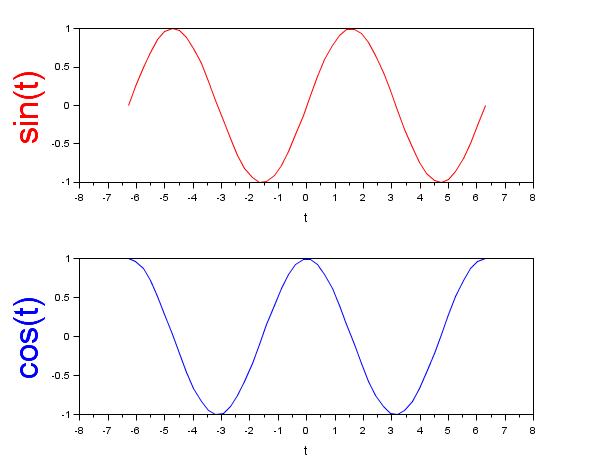
例
t = linspace(-2*%pi, 2*%pi, 30);

subplot(2,1,1);
plot(t, sin(t), "r");
xlabel("t", "fontsize", 2);
ylabel("sin(t)");
axes_handle = gca();

subplot(2,1,2);
plot(t, cos(t), "b");
xlabel("t", "fontsize", 2);
ylabel("cos(t)", "fontsize", 6, "color", "blue");

ylabel(axes_handle, "sin(t)", "fontsize", 6, "color", "red");
参照
- label_properties — Labelエンティティプロパティの説明
- xtitle — グラフィックスウインドにタイトルを追加する
- title — グラフィックウインドウにタイトルを表示する
| Report an issue | ||
| << title | annotation | xtitle >> |