Please note that the recommended version of Scilab is 2026.0.1. This page might be outdated.
See the recommended documentation of this function
detrend
ベクトルから定数, 線形または区分線形トレンドを削除する
呼び出し手順
y = detrend(x)

y = detrend(x,flag)

y = detrend(x,flag,bp)
引数
- x
実数または複素数のベクトルまたは行列 (扱う信号)
- flag
線形または区分線形処理の場合は "linear" (または "l"), 定数処理の場合は "constant" (または "c") に等しい文字列.
- bp
区分線形処理を行う場合に使用する区切点.
- y
出力, 信号x からトレンドを除いたもの.
説明
この関数は,ベクトルxから定数または線形または
区分線形トレンドを削除します. 一般に
この関数はフーリエ解析の前に使うと便利です.
x が行列の場合, この関数は
x の各列のトレンドを除去します.
flag = "constant" or "c" detrend
が定数トレンドを削除する場合,
そして,flag = "linear"または"l"の場合,
この関数は線形トレンドを削除します.
3番目の引数bpを追加することにより,
連続区分線形トレンドを削除することができます.
信号 xの"instants" は 0 から m-1 となることに注意してください
(xがベクトルの場合は m = length(x), x が行列の場合はm = size(x,1)).
このため,区切点bp(i)は,
[0 m-1] の範囲の実数とする必要があります
(範囲外の区切点はbpベクトルから除かれます).
トレンドは,適当な関数空間におけるxの最小二乗フィッティング
により取得されます.
例
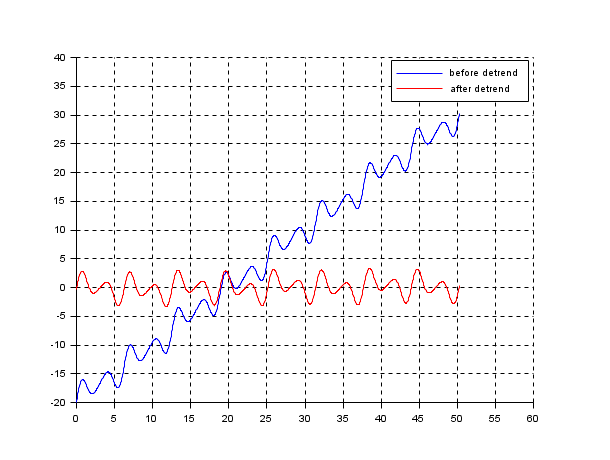
t = linspace(0,16*%pi,1000)';
x = -20 + t + 0.3*sin(0.5*t) + sin(t) + 2*sin(2*t) + 0.5*sin(3*t);
y = detrend(x);
clf()
plot2d(t,[x y],style=[2 5])
legend(["before detrend","after detrend"]);
xgrid()

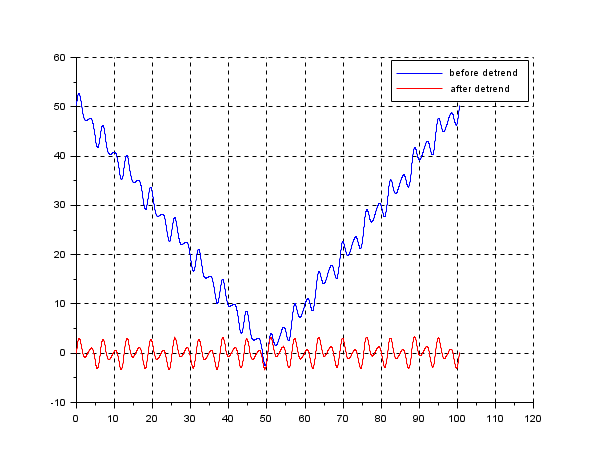
t = linspace(0,32*%pi,2000)';
x = abs(t-16*%pi) + 0.3*sin(0.5*t) + sin(t) + 2*sin(2*t) + 0.5*sin(3*t);
y = detrend(x,"linear",1000);
clf()
plot2d(t,[x y],style=[2 5])
legend(["before detrend","after detrend"]);
xgrid()

| Report an issue | ||
| << Transforms | Signal Processing | xcov >> |