Please note that the recommended version of Scilab is 2026.1.0. This page might be outdated.
See the recommended documentation of this function
datafit
Parameter identification based on measured data
Syntax
[p,err]=datafit([iprint,] G [,DG],Z [,W],[contr],p0,[algo],[df0,[mem]],
[work],[stop],['in'])
Arguments
- iprint
scalar argument used to set the trace mode.
iprint=0nothing (except errors) is reported,iprint=1initial and final reports,iprint=2adds a report per iteration,iprint>2add reports on linear search. Warning: most of these reports are written on the Scilab standard output.
- G
function descriptor (e=G(p,z), e: ne x 1, p: np x 1, z: nz x 1)
- DG
partial of G wrt p function descriptor (optional; S=DG(p,z), S: ne x np)
- Z
matrix [z_1,z_2,...z_n] where z_i (nz x 1) is the ith measurement
- W
weighting matrix of size ne x ne (optional; default no ponderation)
- contr
'b',binf,bsupwithbinfandbsupreal vectors with same dimension asp0.binfandbsupare lower and upper bounds onp.- p0
initial guess (size np x 1)
- algo
'qn'or'gc'or'nd'. This string stands for quasi-Newton (default), conjugate gradient or non-differentiable respectively. Note that'nd'does not accept bounds onx).- df0
real scalar. Guessed decreasing of
fat first iteration. (df0=1is the default value).- mem :
integer, number of variables used to approximate the Hessian, (
algo='gc' or 'nd'). Default value is around 6.- stop
sequence of optional parameters controlling the convergence of the algorithm.
stop= 'ar',nap, [iter [,epsg [,epsf [,epsx]]]]- "ar"
reserved keyword for stopping rule selection defined as follows:
- nap
maximum number of calls to
funallowed.- iter
maximum number of iterations allowed.
- epsg
threshold on gradient norm.
- epsf
threshold controlling decreasing of
f- epsx
threshold controlling variation of
x. This vector (possibly matrix) of same size asx0can be used to scalex.
- "in"
reserved keyword for initialization of parameters used when
funin given as a Fortran routine (see below).- p
Column vector, optimal solution found
- err
scalar, least square error.
Description
datafit is used for fitting data to a model. For
a given function G(p,z), this function finds the best
vector of parameters p for approximating
G(p,z_i)=0 for a set of measurement vectors
z_i. Vector p is found by minimizing
G(p,z_1)'WG(p,z_1)+G(p,z_2)'WG(p,z_2)+...+G(p,z_n)'WG(p,z_n)
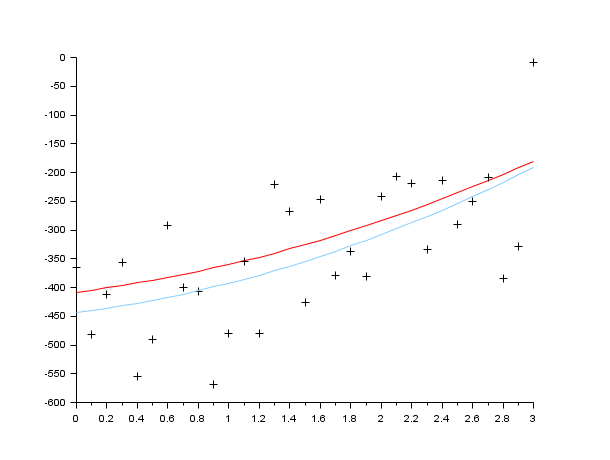
Examples
//generate the data
function y=FF(x, p)
  y=p(1)*(x-p(2))+p(3)*x.*x
endfunction

X=[];
Y=[];
pg=[34;12;14] //parameter used to generate data
for x=0:.1:3
  Y=[Y,FF(x,pg)+100*(rand()-.5)];
  X=[X,x];
end
Z=[Y;X];

//The criterion function
function e=G(p, z),
  y=z(1),x=z(2);
  e=y-FF(x,p),
endfunction

//Solve the problem
p0=[3;5;10]
[p,err]=datafit(G,Z,p0);

scf(0);clf()
plot2d(X,FF(X,pg),5) //the curve without noise
plot2d(X,Y,-1)  // the noisy data
plot2d(X,FF(X,p),12) //the solution
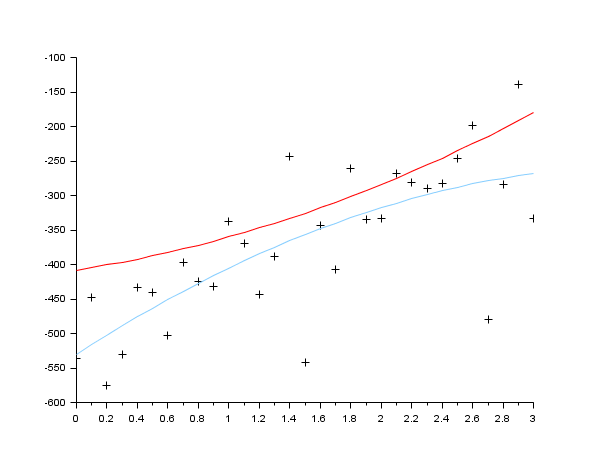
//generate the data
function y=FF(x, p)
  y=p(1)*(x-p(2))+p(3)*x.*x
endfunction

//the gradient of the criterion function
function s=DG(p, z),
  a=p(1),b=p(2),c=p(3),y=z(1),x=z(2),
  s=-[x-b,-a,x*x]
endfunction

function e=G(p, z),
  y=z(1),x=z(2);
  e=y-FF(x,p),
endfunction

X=[];Y=[];
pg=[34;12;14]
for x=0:.1:3
  Y=[Y,FF(x,pg)+100*(rand()-.5)];
  X=[X,x];
end
Z=[Y;X];

p0=[3;5;10]
[p,err]=datafit(G,DG,Z,p0);
scf(1);
clf()
plot2d(X,FF(X,pg),5) //the curve without noise
plot2d(X,Y,-1)  // the noisy data
plot2d(X,FF(X,p),12) //the solution
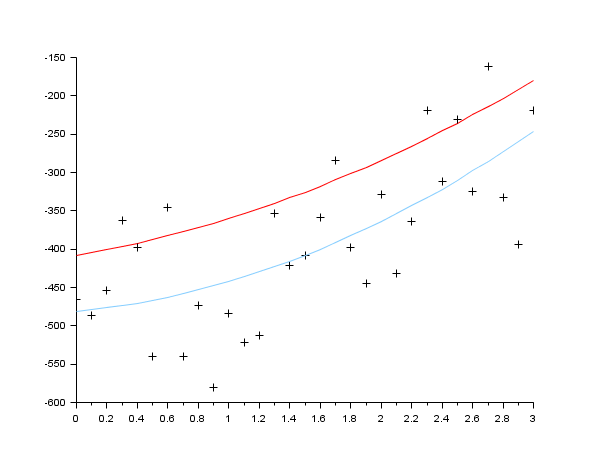
//generate the data
function y=FF(x, p)
  y=p(1)*(x-p(2))+p(3)*x.*x
endfunction

//the gradient of the criterion function
function s=DG(p, z),
  a=p(1),b=p(2),c=p(3),y=z(1),x=z(2),
  s=-[x-b,-a,x*x]
endfunction

function e=G(p, z),
  y=z(1),x=z(2);
  e=y-FF(x,p),
endfunction

X=[];Y=[];
pg=[34;12;14]
for x=0:.1:3
  Y=[Y,FF(x,pg)+100*(rand()-.5)];
  X=[X,x];
end
Z=[Y;X];

p0=[3;5;10]

// Add some bounds on the estimate of the parameters
// We want positive estimation (the result will not change)
[p,err]=datafit(G,DG,Z,'b',[0;0;0],[%inf;%inf;%inf],p0,algo='gc');
scf(1);
clf()
plot2d(X,FF(X,pg),5) //the curve without noise
plot2d(X,Y,-1)  // the noisy data
plot2d(X,FF(X,p),12) //the solution
See also
| Report an issue | ||
| << Nonlinear Least Squares | Nonlinear Least Squares | leastsq >> |