Please note that the recommended version of Scilab is 2026.1.0. This page might be outdated.
See the recommended documentation of this function
PlotSparse
plot the pattern of non nul elements of a sparse matrix
Syntax
PlotSparse(A [,style])
Arguments
- A
a sparse matrix
- style
(optional) a string given the color and/or the marker type of the form "[color][mark]" where color may be a number referring the color you want to use (in the current colormap). If you use the std colormap then color may be one of the following letters :
k  for black       b  for blue
r  for red         g  for green
c  for cyan        m  for magenta
y  for yellow      t  for turquoise
G  a dark green
mark must be one of the following :
.  point           +  plus
x  cross           *  circled plus
D  filled diamond  d  diamond
^  upper triangle  v  down triangle
o  circle
by default you have "b." (in fact the 2d color) and this is also forced in case of error.
Description
plot the pattern of non nul elements of a sparse matrix : each non nul element is drawn with a marker. For "big" matrix use essentially the point . as marker
Examples
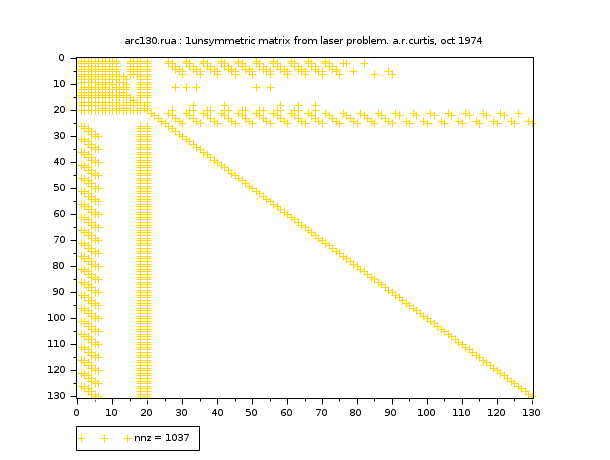
[A,description,ref,mtype] = ReadHBSparse(SCI+"/modules/umfpack/demos/arc130.rua");
PlotSparse(A,"y+")
xtitle(ref + "." + mtype + " : " + description)
See also
- ReadHBSparse — read a Harwell-Boeing sparse format file
| Report an issue | ||
| << condestsp | UMFPACK Interface (sparse) | ReadHBSparse >> |