- Ajuda do Scilab
- Biblioteca de Gráficos
- 2d_plot
- champ
- champ1
- champ_properties
- comet
- contour2d
- contour2di
- contour2dm
- contourf
- errbar
- fchamp
- fec
- fec properties
- fgrayplot
- fplot2d
- grayplot
- grayplot_properties
- graypolarplot
- histplot
- LineSpec
- Matplot
- Matplot1
- Matplot properties
- paramfplot2d
- plot
- plot2d
- plot2d2
- plot2d3
- plot2d4
- polarplot
- scatter
- Sfgrayplot
- Sgrayplot
Please note that the recommended version of Scilab is 2026.1.0. This page might be outdated.
See the recommended documentation of this function
Matplot properties
Description of the Matplot entities properties
Description
The Matplot entity is a leaf of the graphics entities hierarchy. It
represents 2D plots of surface using colors and images (see
Matplot and Matplot1).
- parent
Graphic handle of the Matplot's parent, that should be of the type
"Axes".- children
vector of
childrenof the Matplot object. By default, aMatplotentity has nochild, and.childrenis[].- visible
"on"(default) or"off". If"off", the Matplot patch is not displayed.- data
(m,n)matrix or(m,n,nc)hypermatrix of decimal, (u)int8, (u)int16, or (u)int32 numbers representing a matrix of (m,n) colors onnc = 1|3|4channels to be plotted. The color encoding/decoding is set by theimage_typeproperty. The color associated todata(i,j,:)is used do draw and fill a small rectangle of fixed sizes touching its neighboors and centered at the(i,j)location.- rect
vector
[xmin, ymin, xmax, ymax]defining a rectangle in data scales of the parent axes. The fulldatamatrix is scaled accordingly to fill therectshape:- Its
mrows cover the[ymin, ymax]interval. - Its
ncolumns cover the[xmin, xmax]interval.
The
data(i,j)pixel is drawn in the small rectangle bounded byX = xmin + [j-1, j]*(xmax-xmin)/nandY = ymax - [i-1, i]*(ymax-ymin)/mIf one
rectbound goes beyond the corresponding.parent.data_bounds(i)axes bound, the overflowing side of thedatamatrix will be clipped, unless.clip_stateis set to"off".- Its
- image_type
this field defines the image type. It could be one of the values: "index", "gray", "rgb", "rgba", "argb", "red", "green", "blue", "rgb332", "rgb444", "rgb555", "rgb4444", "rgb5551".
Colors are determinated by the data type and by
image_type:- "index"
dataare colors indices in the colormap.- "gray"
dataas a matrix of int8 or uint8 provides Gray level color (R-G-B=GRAY-GRAY-GRAY).- Otherwise,
datais considered as RGB levels and converted into gray colors (0.299*R+0.587*G+0.114*B).
- "rgb"
dataas an hypermat of int8 or uint8 provides the RGB components ;dataas an hypermat of doubles provides normalized RGB components (values between 0 and 1) ;dataas a matrix of int8 or uint8 with a number of rows multiple of 3 provides the RGB components ;dataas a matrix of int32 provides RGB colors ;dataas a matrix of uint32 provides RGBA colors where the alpha channel will be set to 0xFF.
- "rgba"
dataas an hypermat of int8 or uint8 provides the RGBA components ;dataas an hypermat of doubles provides normalized RGBA components (values between 0 and 1) ;dataas a matrix of int8 or uint8 with a number of rows multiple of 4 provides the RGBA components ;dataas a matrix of int32 or uint32 provides RGBA colors.
- "argb"
dataas an hypermat of int8 or uint8 provides the ARGB components ;dataas an hypermat of doubles provides normalized ARGB components (values between 0 and 1) ;dataas a matrix of int8 or uint8 with a number of rows multiple of 4 provides the ARGB components ;dataas a matrix of int32 or uint32 provides ARGB colors.
- "red"
dataas a matrix of int8 or uint8 provides Red level color (R-G-B=RED-00-00).dataof another type is considered as RGB intensities. They are then converted into red levels (a mask is applied to keep the Red component).
- "green"
dataas a matrix of int8 or uint8 provides Green level color (R-G-B=00-GREEN-00).dataof another type is considered as RGB intensities. They are then converted into green levels (a mask is applied to keep the Green component).
- "blue"
dataas a matrix of int8 or uint8 provides Blue level color (R-G-B=00-00-BLUE) ;dataof another type is considered as RGB intensities. They are then converted into blue levels (a mask is applied to keep the Blue component).
- "rgb332"
dataas a matrix of int8 or uint8 provides RGB colors where R component is wrote on 3 bits, G component on 3 bits and B component on 2 bits.- For other
datatypes, RGB (8-8-8) data are converted into RGB (3-3-2).
- "rgb444"
dataas a matrix of int16 or uint16 provides RGB colors where each components is wrote on 4 bits.- For other
datatypes, RGB (8-8-8) data are converted into RGB (4-4-4).
- "rgb555"
dataas a matrix of int16 or uint16 provides RGB colors where each components is wrote on 5 bits.- For other
datatypes, RGB (8-8-8) data are converted into RGB (5-5-5).
- "rgb4444"
dataas a matrix of int16 or uint16 provides RGBA colors where each components is wrote on 4 bits.- For other
datatypes, RGBA (8-8-8-8) data are converted into RGBA (4-4-4-4).
- "rgb5551"
dataas a matrix of int16 or uint16 provides RGBA colors where each non-alpha components is wrote on 5 bits and the alpha component on 1 bit.- For other
datatypes, RGBA (8-8-8-8) data are converted into RGBA (5-5-5-1).
- clip_state
Its value drives the clipping of the
Matplotpatch outside its parentAxesbox. Possible values are:"off": The Matplot patch is not clipped. Setting.clip_state = "off"automatically resets.clip_box = []."clipgrf": The Matplot patch is clipped outside its parent axes. Setting.clip_state = "clipgrf"automatically resets.clip_box = []."on": The Matplot patch is clipped outside the rectangle defined by theclip_boxproperty.
- clip_box
empty matrix
[](default) or[x,y,w,h](upper-left point width height) bounds (in data scales) of the rectangular area outside which the Matplot patch must be clipped. Setting.clip_box = [x y w h]automatically sets.clip_state = "on".- user_data
this field can be use to store any scilab variable in the
Matplotdata structure, and to retrieve it.- tag
Single text that can be used as identifier/name of the Matplot object.
findobj("tag", tag_value)will then return its full graphic handle.
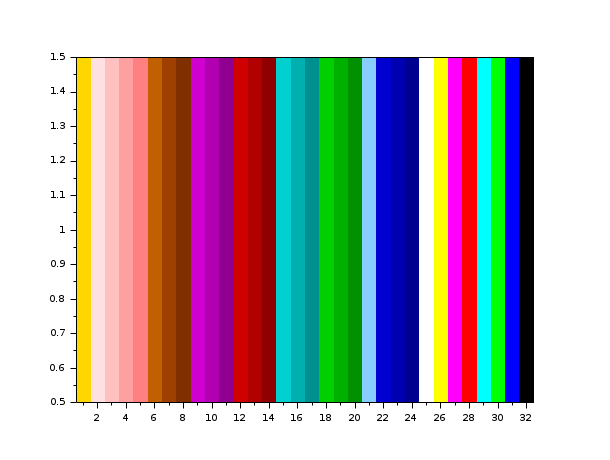
Examples
nbcolors = size(gcf().color_map, 1);
Matplot(1:nbcolors)
e = gce(); // get current entity
e.data = e.data($:-1:1) // reverse order
See also
- Matplot — esboço 2d de uma matriz utilizando-se cores
- Matplot1 — Esboço 2d de matrizes utilizando cores
- grayplot — esboço 2d de uma superfície utilizando-se cores
- grayplot_properties — description of the grayplot entities properties
- xrects — desenha ou preenche um conjunto de retângulos
- graphics_entities — Descrição das estruturas de dados de entidades gráficas
History
| Versão | Descrição |
| 5.5.0 |
|
| Report an issue | ||
| << Matplot1 | 2d_plot | paramfplot2d >> |