Please note that the recommended version of Scilab is 2026.1.0. This page might be outdated.
However, this page did not exist in the previous stable version.
hist3d
representação 3d de um histograma
Seqüência de Chamamento
hist3d(mtx,[theta,alpha,leg,flag,ebox])
hist3d(mtx,<opt_args>)
hist3d(list(mtx,x,y),[theta,alpha,leg,flag,ebox])
hist3d(list(mtx,x,y),<opt_args>)
Parâmetros
- mtx
matriz de tamanho (m,n) definindo o histograma
mtx(i,j)=F(x(i),y(j)), ondexeyasão tomados como0:me0:n.- list(mtx,x,y)
onde f é uma matriz de tamanho (m,n) definindo o histograma
mtx(i,j)=F(x(i),y(j)), com vetoresxeyde tamanho (1,n+1) e (1,m+1).- theta,alpha,leg,flag,ebox
ver
plot3d.
Descrição
hist3d representa um histograma 2d como um esboço
3d. Os valores são associados aos intervalos [x(i) x(i+1)[ X
[y(i) y(i+1)[
.
Entre com o comando hist3d() para visualizar uma
demonstração.
Exemplos
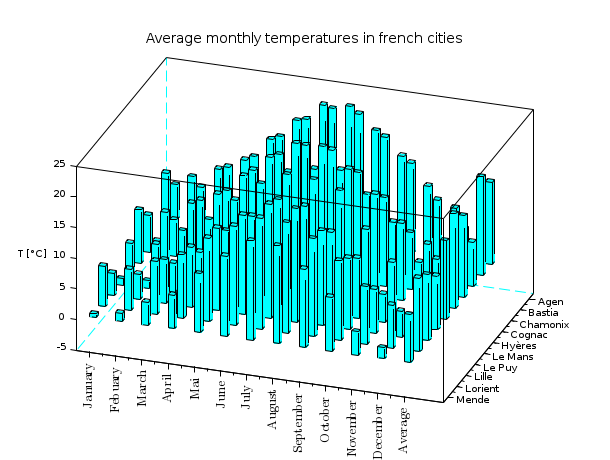
hist3d();
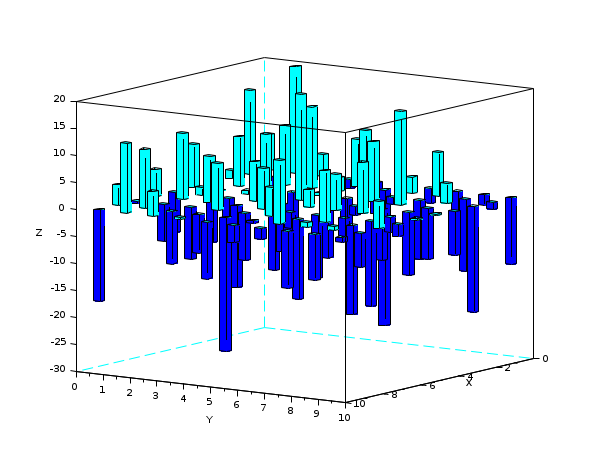
hist3d(10*rand(10,10));
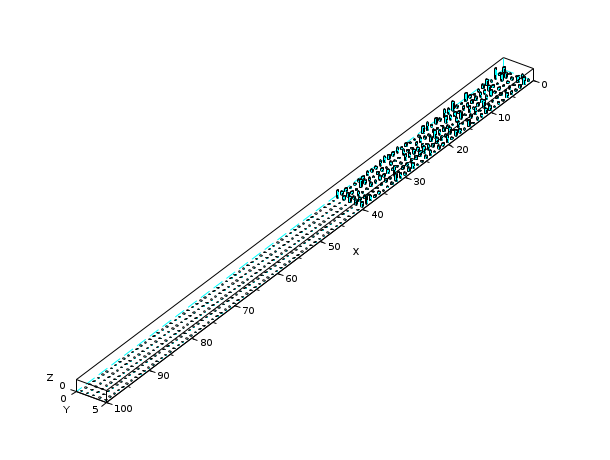
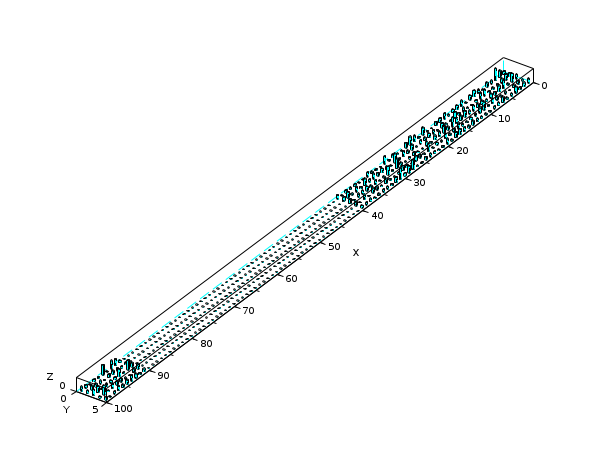
Z = zeros(100,5);
A = abs(rand(40,5));
Z(1:40,:) = A;
Index = find(Z==0);
Z(Index) = %nan;
scf();
hist3d(Z);
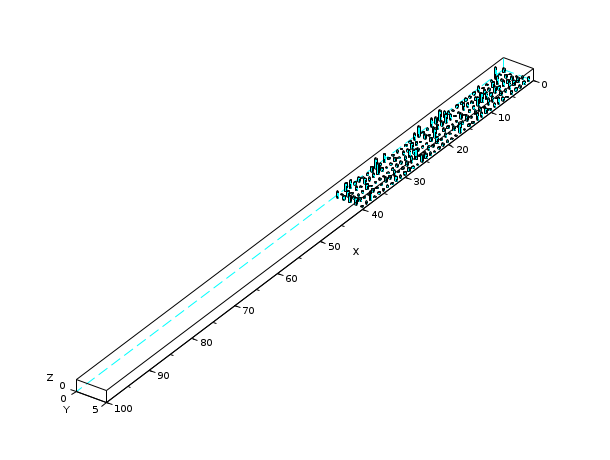
Z = zeros(100,5);
A = abs(rand(40,5));
Z(1:40,:) = A;
A = abs(rand(10,5));
Z(91:100,:) = A;
scf();
hist3d(Z);
Autores
Steer S. & JPhilippe C.
| Report an issue | ||
| << geom3d | 3d_plot | mesh >> |