- Aide de Scilab
- Graphiques
- 2d_plot
- contour2di
- contourf
- errbar
- fec
- fgrayplot
- histplot
- paramfplot2d
- LineSpec
- Matplot
- Matplot1
- Matplot properties
- Sfgrayplot
- Sgrayplot
- champ
- champ1
- champ properties
- comet
- contour2d
- contour2dm
- fchamp
- fcontour2d
- fec properties
- fplot2d
- grayplot
- grayplot properties
- graypolarplot
- plot
- plot2d
- plot2d1
- plot2d2
- plot2d3
- plot2d4
- polarplot
Please note that the recommended version of Scilab is 2026.1.0. This page might be outdated.
See the recommended documentation of this function
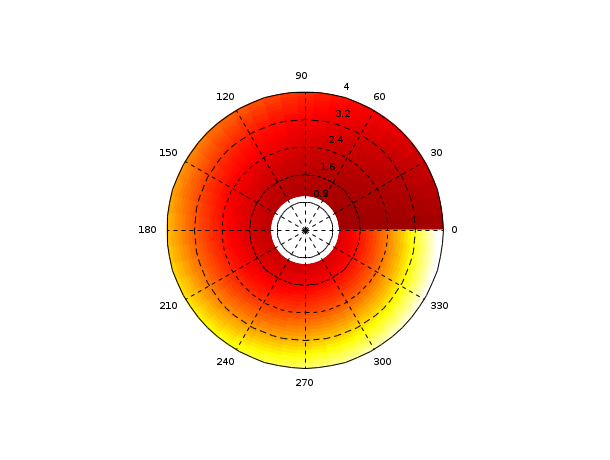
graypolarplot
Polar 2D plot of a surface using colors
Calling Sequence
graypolarplot(theta,rho,z,[strf,rect])
Arguments
- theta
a vector with size n1, the discretization of the the angle in radian.
- rho
a vector with size n2, the discretization of the radius
- z
real matrix of size (n1,n2).
z(i,j)is the value of the surface at the point (theta(i),rho(j)).- strf
is a string of length 3
"xy0".- default
The default is
"030".- x
controls the display of captions.
- x=0
no captions.
- x=1
captions are displayed. They are given by the optional argument
leg.
- y
controls the computation of the frame.
- y=0
the current boundaries (set by a previous call to another high level plotting function) are used. Useful when superposing multiple plots.
- y=1
the optional argument
rectis used to specify the boundaries of the plot.- y=2
the boundaries of the plot are computed using min and max values of
xandy.- y=3
like
y=1but produces isoview scaling.- y=4
like
y=2but produces isoview scaling.- y=5
like
y=1butplot2dcan change the boundaries of the plot and the ticks of the axes to produce pretty graduations. When the zoom button is activated, this mode is used.- y=6
like
y=2butplot2dcan change the boundaries of the plot and the ticks of the axes to produce pretty graduations. When the zoom button is activated, this mode is used.- y=7
like
y=5but the scale of the new plot is merged with the current scale.- y=8
like
y=6but the scale of the new plot is merged with the current scale.
- leg
a string. It is used when the first character x of argument
strfis 1.leghas the form"leg1@leg2@...."whereleg1,leg2, etc. are respectively the captions of the first curve, of the second curve, etc. The default is"".- rect
This argument is used when the second character y of argument
strfis 1, 3 or 5. It is a row vector of size 4 and gives the dimension of the frame:rect=[xmin,ymin,xmax,ymax].
Description
Takes a 2D plot of the surface given by z on a polar
coordinate grid defined by rho and theta. Each
grid region if filled with a gray or color level depending on the average
value of z on the corners of the grid.
Examples
rho=1:0.1:4;theta=(0:0.02:1)*2*%pi;
z=30+round(theta'*(1+rho.^2));
f=gcf();
f.color_map= hotcolormap(128);
clf();graypolarplot(theta,rho,z)
| Report an issue | ||
| << grayplot properties | 2d_plot | plot >> |