- Справка Scilab
- GUI
- Borders
- Layouts
- uitree
- about
- addmenu
- clipboard
- close
- Console properties
- createWindow
- delmenu
- exportUI
- figure
- findobj
- gcbo
- getcallbackobject
- getinstalledlookandfeels
- getlookandfeel
- getvalue
- Interactive Editor
- loadGui
- messagebox
- printfigure
- printsetupbox
- progressionbar
- root_properties
- saveGui
- setlookandfeel
- setmenu
- toolbar
- toprint
- tree_show
- uicontextmenu
- uicontrol
- uicontrol properties
- uigetcolor
- uigetdir
- uigetfile
- uigetfont
- uimenu
- uimenu properties
- uiputfile
- unsetmenu
- usecanvas
- waitbar
- x_choices
- x_choose
- x_choose_modeless
- x_dialog
- x_matrix
- x_mdialog
Please note that the recommended version of Scilab is 2026.1.0. This page might be outdated.
See the recommended documentation of this function
Interactive Editor
Interactive plot editor
Description
The interactive plot editor added new features to scilab, now the user can interact with the plot window and the graphic objects without using a single line of code.
The interactive plot editor provides the following features:
Editor menu:
Graphic entity selection
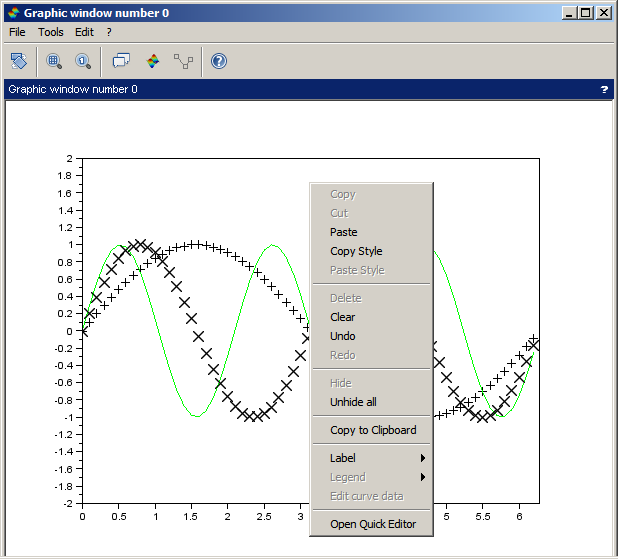
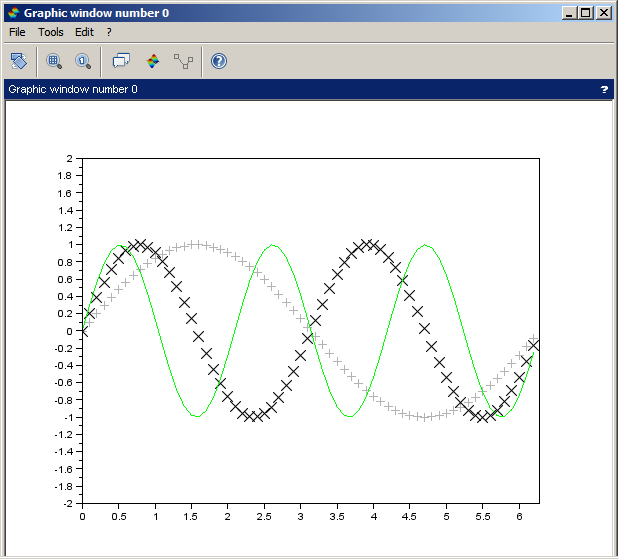
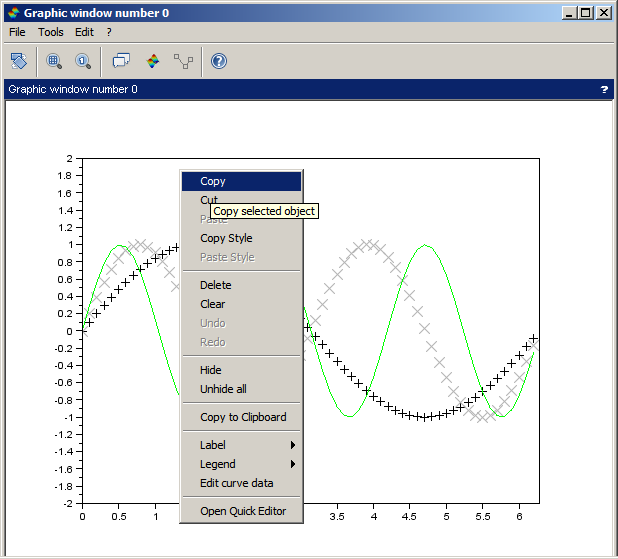
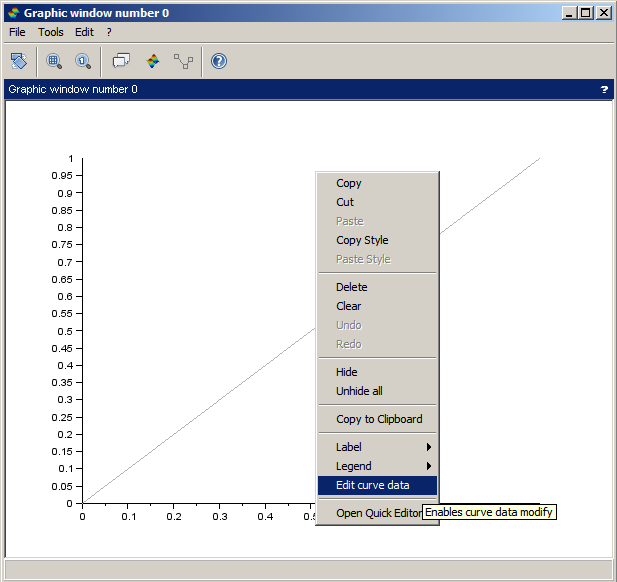
The user can select curves, surfaces and legends on the plot window.To select an entity, you need just click on it.
Copy, Cut, Paste
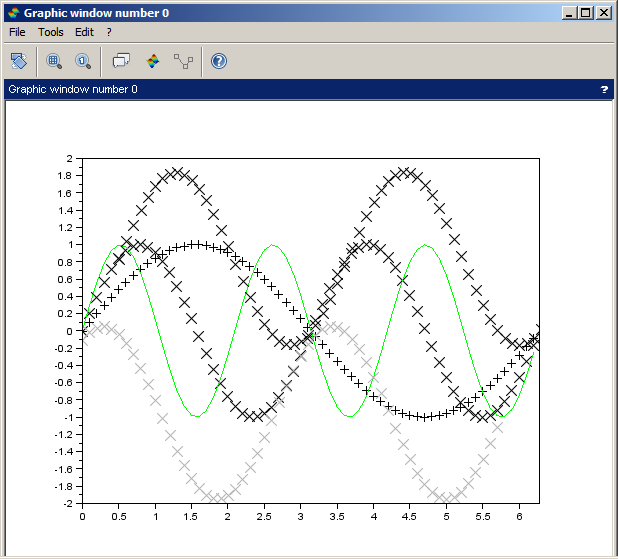
Selected entities can be copied/cutted and be pasted to others figures (except legends).To copy/cut an entity: select it, right click copy/cut.
Copy axes style
The axes properties can be copied and pasted to ease formatting between figures.To copy the axes style: right click in the figure and "copy style".

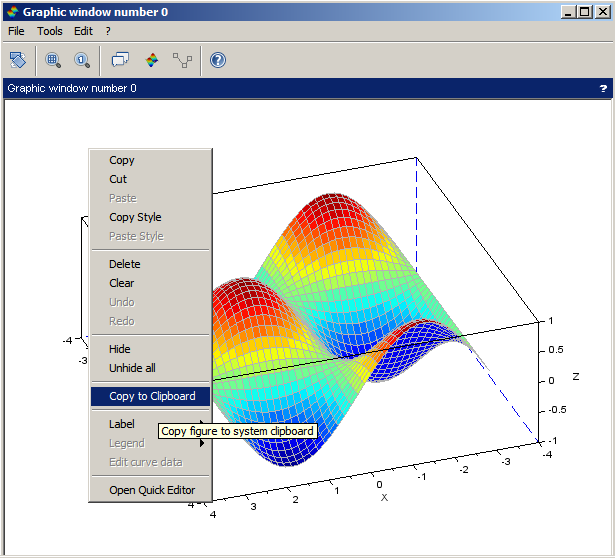
Copy to clipboard
The figure can be copied to the system clipboard, and pasted to others programs (like Word).To copy the figure to the clipboard: right click, copy to clipboard
Delete
Deletes the selected entity.To delete an entity: select it, right click, delete

Hide, Unhide
Enables the user to hide the selected entity and unhide all hidden entities.To hide an entity: select it, right click, hide.

Undo / Redo
Almost any action done with the editor can be undone/ redone.To undo/redo an action, right click, "undo"/redo.
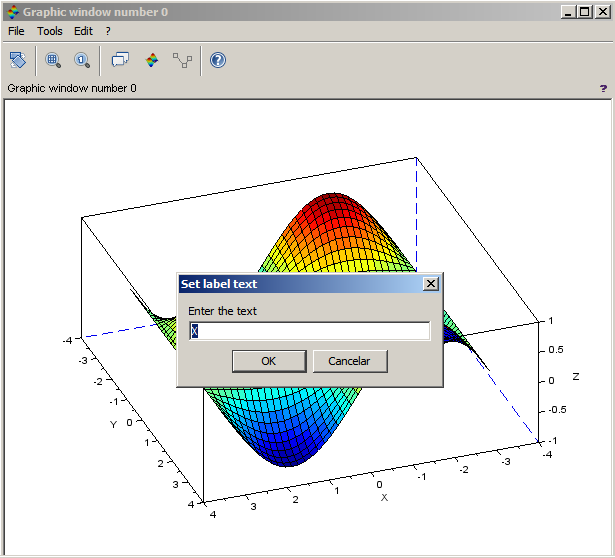
Labels
With a simply right click the user can insert labels in the axes, and doing a double click over a label text opens a dialog to edit its text.
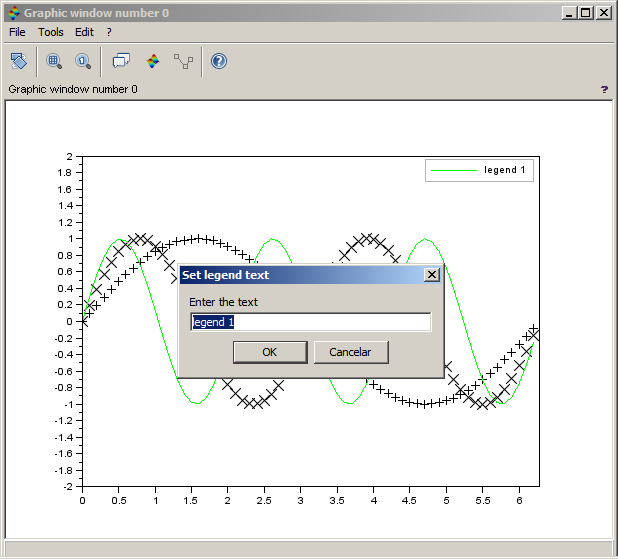
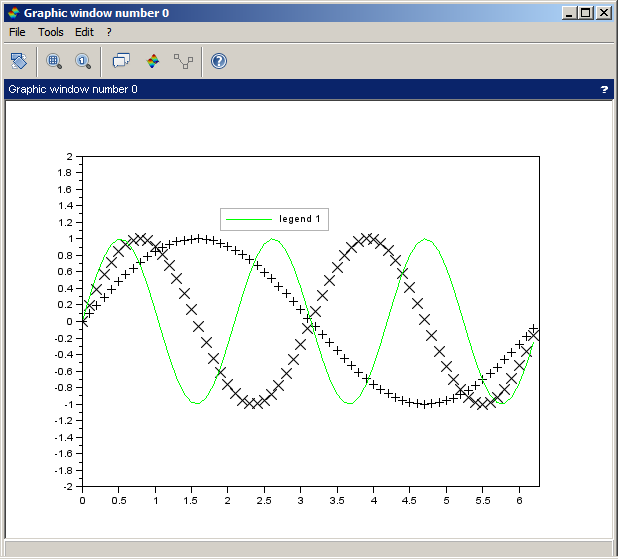
Legends
With a simply right click the user can insert a legend to the selected curve or remove it, and doing a double click over a legend box opens a dialog to edit its text.
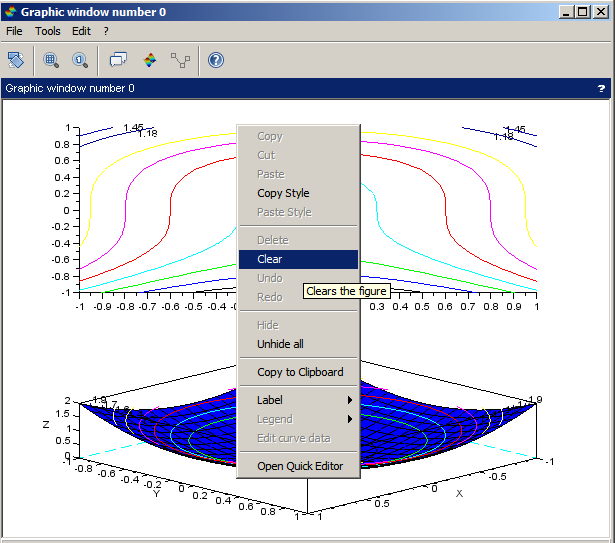
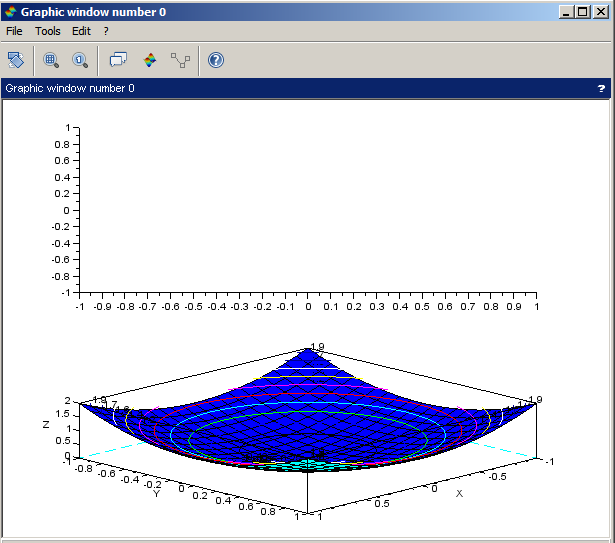
Clear
Clears the figure.Clear action isn't added to the undo/redo history.
Open GED
With a simply right click the user can open the ged with the properties from the selected/right clicked entity.
Move objects
To move objects: enable the data editor mode, select and drag an object.
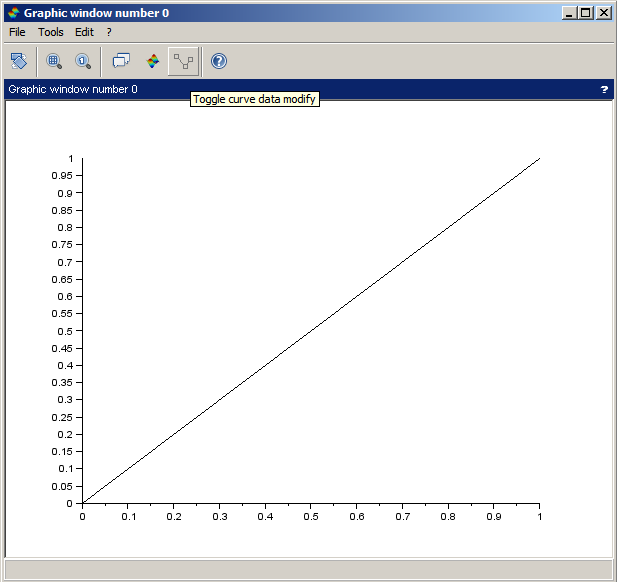


Graphically curve data editor
To edit a curve data: enable the data editor mode, select an object, right click, edit curve data or double click over curve.
To add a point: with the selected curve in edit mode, right click, "insert" or double click over the curve.
To remove a point: with the selected curve in edit mode, right click, "remove".
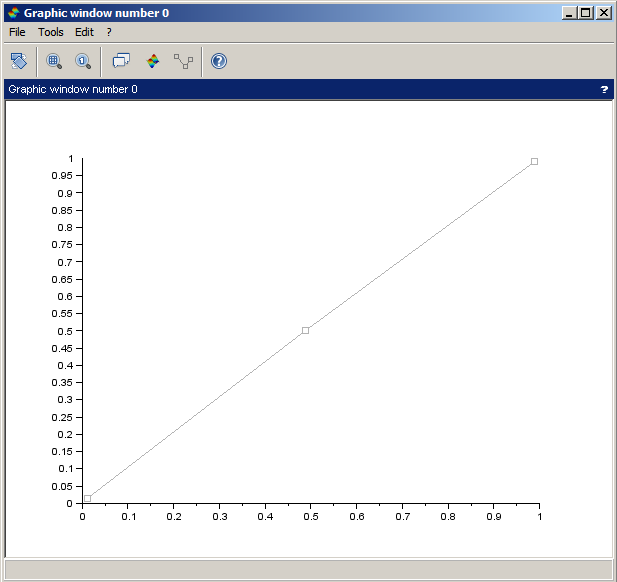
To move a point: with the selected curve in edit mode, click in the point and drag it.
| Report an issue | ||
| << getvalue | GUI | loadGui >> |