Scilab 5.5.0
Please note that the recommended version of Scilab is 2026.1.0. This page might be outdated.
See the recommended documentation of this function
replot
カレントのグラフィックウインドウを新しい境界に 再描画
呼び出し手順
replot(area)
replot(area, axesHandles)
引数
- area
大きさ 4の行ベクトル.
- axesHandles
オプションの引数. 一つまたは複数のAxesを選択するための Axes型のグラフィックハンドル.
説明
replot はカレントのグラフィックウインドウの内容を
area = [xmin,ymin, xmax,ymax]のかのarea = [xmin,ymin,zmin, xmax,ymax,zmax]で定義した新しい境界内に
再描画する際に使用されます.
この変換はaxesHandles引数でAxesグラフィックハンドルにより指定された特定の軸に
適用されます.
新しい境界はカレントの図のカレントの軸に適用されます.
変換はこれらの軸のdata_boundsの値を変更します.
axesのプロパティ
 | tight_limitsも
これらの境界を厳密に選択するために "on" に設定する必要があります |
例
// 二番目の例
xdel(winsid());
plot() // plot demo
f=gcf();
replot([-1,-1,10,2],f.children(1)) // axesハンドルの値を指定
replot([-3,-2,8,4],f.children(2))
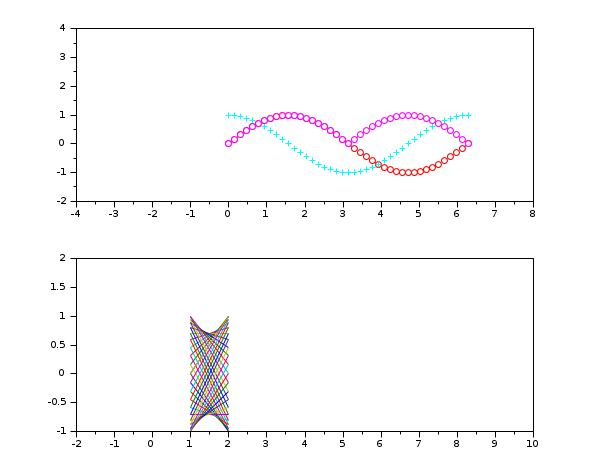
//値は%nanで示さ端子は変更されません。
x = linspace(0,360,200).';
clf
plot2d(x,[sind(x) tand(x)])
ax = gca();
ax.data_bounds                // 初期限界
replot([%nan,-10,%nan,10])    // YminとYmaxのだけ変更され
ax.data_bounds                // 新しい制限
// 3D端末Zも変更できます。
clf
x = linspace(-4,4,100);
X = meshgrid(x);
R = (X-0.5).^2 + (X.'+0.7).^2;
Z = sinc(R);
surf(x-0.5,x+0.7,Z)
f = gcf();
f.color_map = autumncolormap(100);
ax = gca();
ax.data_bounds
sleep(3000)
replot([-5 0 -0.4 0 5 0.5])
ax.data_bounds
// いくつかのグラフィカルなマーカーを同時にトリミングすることができます。
clf
x = linspace(-%pi,%pi,400);
subplot(2,2,1)
plot2d(x,sin(1 ./sqrt(abs(x))))
ax1 = gca();
subplot(2,2,2)
plot2d(x,sinh(sqrt(abs(x))))
subplot(2,1,2)
plot2d(x,cos(1 ./sqrt(abs(x))))
ax2 = gca();
sleep(4000)
f = gcf();
replot([-1 %nan 1.5 %nan], [ax1 ax2])
参照
- zoom_rect — カレントのグラフィック図の選択した部分をズーム
- rubberbox — 矩形選択用の輪ゴムボックス
- axes_properties — axesエンティティプロパティの説明
歴史的
| バージョン | 記述 |
| 5.5.0 |
|
| Report an issue | ||
| << plotframe | axes_operations | rotate_axes >> |