- Scilab Help
- Graphics
- 2d_plot
- 3d_plot
- annotation
- axes_operations
- axis
- bar_histogram
- Color management
- Datatips
- figure_operations
- geometric_shapes
- handle
- interaction
- lighting
- load_save
- pie
- polygon
- property
- text
- transform
- window_control
- GlobalProperty
- Graphics: Getting started
- Compound properties
- Graphics Entities
- object editor
- pixel_drawing_mode
- Segments properties
- twinkle
- xchange
- xclear
- xdel
- xget
- xgetech
- xgraduate
- xgrid
- xname
- xnumb
- xpause
- xsegs
- xset
- xsetech
- xsetm
Please note that the recommended version of Scilab is 2026.1.0. This page might be outdated.
See the recommended documentation of this function
xsetech
set the sub-window of a graphics window for plotting
Calling Sequence
xsetech(wrect, [frect, logflag])
xsetech(wrect=[...], frect=[..], logflag="..", arect=[...])
xsetech()
Arguments
- wrect
a vector of size 4, defining the sub-window to use.
- frect
a vector of size 4.
- logflag
a string of size 2
"xy", wherexandycan be"n"or"l"."n"stands for normal and "l" stands for logscale.xstands for the x-axis andystands for the y-axis.- arect
a vector of size 4.
Description
xsetech is mainly used to set the sub-window of
the graphics window which will be used for plotting. The sub-window
is specified with the parameter wrect=[x,y,w,h]
(upper-left point, width, height). The values in
wrect are specified using proportion of
the width or height of the current graphic window. For instance
wrect=[0, 0, 1, 1] means that the whole graphics
window will be used, and wrect=[0.5, 0, 0.5, 1]
means that the graphics region will be the right half of the
graphics window.
xsetech also set the current graphics scales
for 2D plotting and can be used in conjunction with graphics
routines which request the current graphics scale (for instance
strf="x0z" or frameflag=0 in
plot2d).
frect=[xmin, ymin, xmax, ymax] is used to set the
graphics scale and is just like the rect argument
of plot2d. If frect is not
given the current value of the graphic scale remains unchanged. the
default value of rect is [0,0,1,1]
(at window creation, when switching back to default value with
xset('default') or when clearing graphic recorded
events clf()).
arect=[x_left, x_right,y_up,y_down] is used to
set the graphic frame inside the sub-window. The graphic frame is
specified (like wrect) using proportion of the
width or height of the current graphic sub-window. Default value is
1/8*[1,1,1,1]. If arect is not
given, current value remains unchanged.
Examples
// To get a graphical explanation of xsetech parameters enter:
exec('SCI/modules/graphics/demos/xsetechfig.sce');

// Here xsetech is used to split the graphics window in two parts
// first xsetech is used to set the first sub-window
// and the graphics scale
xsetech([0,0,1.0,0.5],[-5,-3,5,3])
// we call plot2d with the "001" option to use the graphics scale
// set by xsetech
plot2d([1:10]',[1:10]',1,"001"," ")
// then xsetech is used to set the second sub-window
xsetech([0,0.5,1.0,0.5])
// the graphics scale is set by xsetech to [0,0,1,1] by default
// and we change it with the use of the rect argument in plot2d
plot2d([1:10]',[1:10]',1,"011"," ",[-6,-6,6,6])
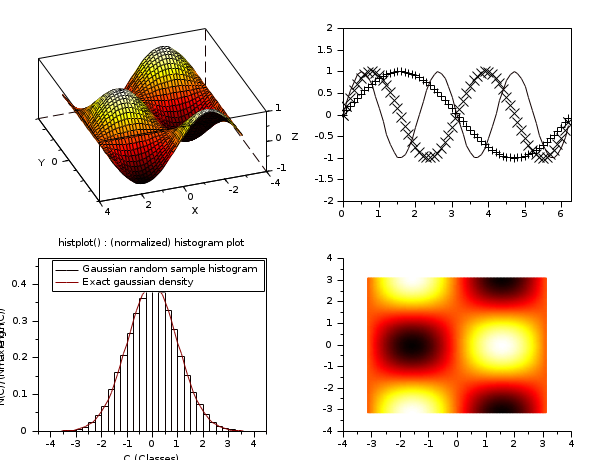
// Four plots on a single graphics window
clf()
xset("font",2,0)
xsetech([0,0,0.5,0.5]);
plot3d()
xsetech([0.5,0,0.5,0.5]);
plot2d()
xsetech([0.5,0.5,0.5,0.5]);
grayplot()
xsetech([0,0.5,0.5,0.5]);
histplot()
// back to default values for the sub-window
xsetech([0,0,1,1])
See Also
| Report an issue | ||
| << xset | Graphics | xsetm >> |