Scilab 5.4.1
Please note that the recommended version of Scilab is 2026.1.0. This page might be outdated.
See the recommended documentation of this function
xpoly
ポリラインまたはポリゴンを描画する
呼び出し手順
xpoly(xv,yv [,dtype [,close]])
引数
- xv,yv
同じ大きさの行列 (ポリラインの点).
- dtype
文字列 (描画形式). デフォルト値は "lines".
- close
整数. close=1の場合, ポリラインは閉じられます; デフォルト値は 0です.
説明
xpoly は座標xv およびyvの
ベクトルにより記述されるポリラインを1つ描画します.
xv および
yv が行列の場合, これらは列を結合したベクトルとみなされます.
dtype はカレントの線種を用いる場合には
"lines",ポリラインを描画する際に
カレントのマーカを使用する場合には"marks"となります.
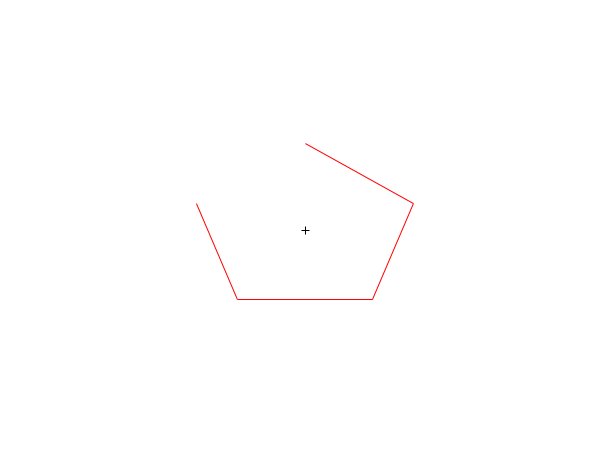
例
x=sin(2*%pi*(0:4)/5);
y=cos(2*%pi*(0:4)/5);

plot2d(0,0,-1,"010"," ",[-2,-2,2,2])
xset("color",5)
xpoly(x,y,"lines",1) // デフォルトで閉じられます

e=gce(); // カレントのエンティティを取得 (直近に作成: ここではポリライン)
e.closed = 'off' // ポリラインはオープンされます
| Report an issue | ||
| << xfpolys | polygon | xpolys >> |