Scilab 5.4.1
Please note that the recommended version of Scilab is 2026.0.1. This page might be outdated.
See the recommended documentation of this function
xlabel
x軸ラベルを付加する
ylabel
y軸ラベルを付加する
zlabel
z軸ラベルを付加する
呼び出し手順
xlabel("string label")
xlabel("string label", "PropertyName", PropertyValue)
ylabel("string label")
ylabel("string label", "PropertyName", PropertyValue)
zlabel("string label")
zlabel("string label", "PropertyName", PropertyValue)
引数
- "string label"
文字列: カレントの軸の軸ラベル
- "PropertyName"
文字列: プロパティ名
- PropertyValue
プロパティの値
説明
各軸のグラフィックオブジェクトは, x, y, および z軸に各一つのラベルを有することができます.
このラベルは2次元プロットでは対応する軸の下, 3次元プロットでは軸の横または下に表示されます.
例
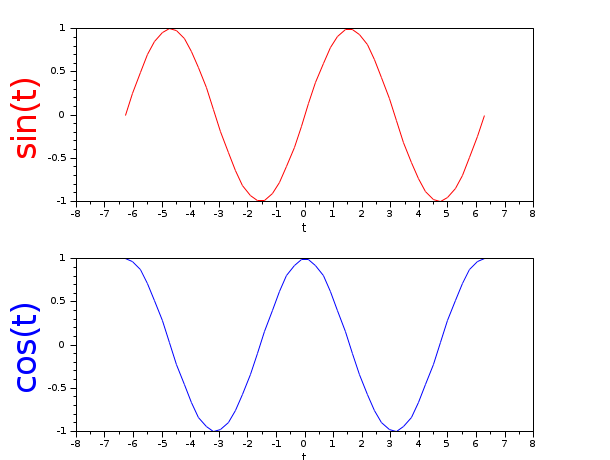
t = linspace(-2*%pi, 2*%pi, 30);

subplot(2,1,1);
plot(t, sin(t), "r");
xlabel("t", "fontsize", 2);
ylabel("sin(t)");
axis1_handle = gca();

subplot(2,1,2);
plot(t, cos(t), "b");
xlabel("t", "fontsize", 2);
ylabel("cos(t)", "fontsize", 6, "color", "blue");

ylabel(axis1_handle, "sin(t)", "fontsize", 6, "color", "red");

参照
- title — グラフィックウインドウにタイトルを表示する
| Report an issue | ||
| << title | annotation | xtitle >> |