Scilab 5.4.1
Please note that the recommended version of Scilab is 2026.1.0. This page might be outdated.
See the recommended documentation of this function
replot
カレントのグラフィックウインドウを新しい境界に 再描画
呼び出し手順
replot(rect,[handle])
引数
- rect
大きさ 4の行ベクトル.
- handle
オプションの引数. 一つまたは複数のAxesを選択するための Axes型のグラフィックハンドル.
説明
replot はカレントのグラフィックウインドウの内容を
rect=[xmin,ymin,xmax,ymax]で定義した新しい境界内に
再描画する際に使用されます.
古いグラフィック構文では,"Rec"ドライバでのみ
動作します.
この変換はhandle引数でAxesグラフィックハンドルにより指定された特定の軸に
適用されます.
新しい境界はカレントの図のカレントの軸に適用されます.
変換はこれらの軸のdata_boundsの値を変更します.
axesのプロパティtight_limitsも
これらの境界を厳密に選択するために "on" に設定する必要があります
(
axes_propertiesを参照ください).
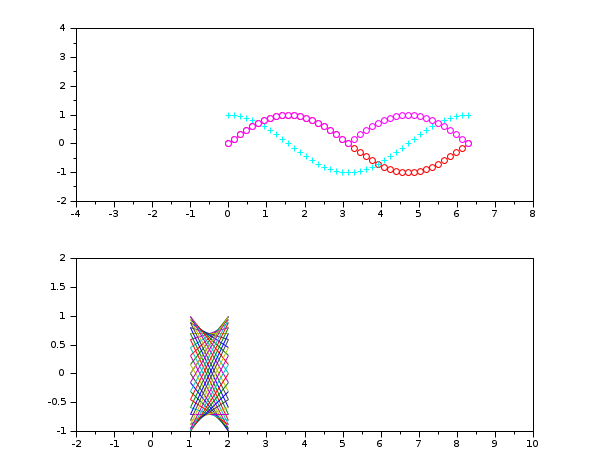
例

// 二番目の例
xdel(winsid());
plot() // plot demo
f=gcf();
replot([-1,-1,10,2],f.children(1)) // axesハンドルの値を指定
replot([-3,-2,8,4],f.children(2))
参照
- clf — カレントの図をクリアし,デフォルト値にリセットする
| Report an issue | ||
| << plotframe | axes_operations | rotate_axes >> |