Please note that the recommended version of Scilab is 2026.0.1. This page might be outdated.
See the recommended documentation of this function
replot
redraw the current graphics window with new boundaries
Calling Sequence
replot(rect,[handle])
Arguments
- rect
row vector of size 4.
- handle
optional argument. Graphics handle(s) of type Axes to select one or several given Axes.
Description
replot is used to redraw the content of the current
graphics window with new boundaries defined by
rect=[xmin,ymin,xmax,ymax]. Under old graphics syntax, it
works only with the driver "Rec".
This transformation can be applied to specific
axes given by Axes graphics handles via the handle argument. If handle is
not specified, the new boundaries are applied to the current axes of the
current figure. The transformation changes the data_bounds
value of those axes. Note that the axes property tight_limits
must also be set to "on" to strictly select those bounds (see
axes_properties).
Examples

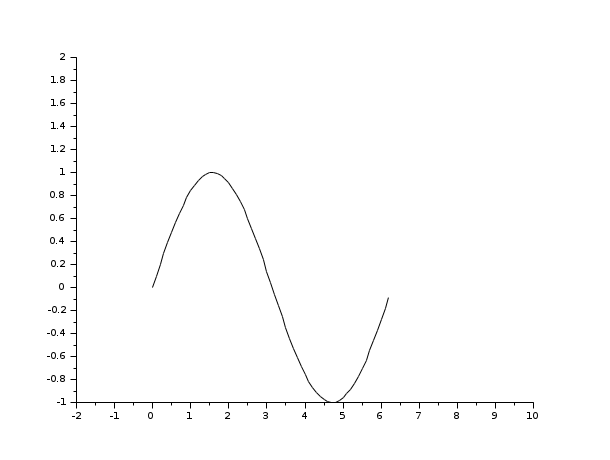
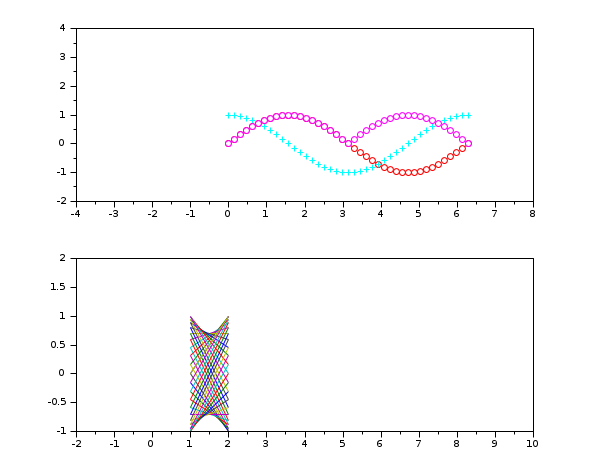
xdel(winsid());
plot() // plot demo
f=gcf();
replot([-1,-1,10,2],f.children(1)) // specify axes handle's value
replot([-3,-2,8,4],f.children(2))

See Also
- clf — clear or reset the current graphic figure (window) to default values
| Report an issue | ||
| << plotframe | axes_operations | rotate_axes >> |