Scilab 5.4.1
- Aide Scilab
- Graphiques
- 2d_plot
- contour2di
- contourf
- errbar
- fec
- fgrayplot
- histplot
- paramfplot2d
- LineSpec
- Matplot
- Matplot1
- Matplot properties
- Sfgrayplot
- Sgrayplot
- champ
- champ1
- champ properties
- comet
- contour2d
- fchamp
- fcontour2d
- fec properties
- fplot2d
- grayplot
- grayplot properties
- graypolarplot
- plot
- plot2d
- plot2d1
- plot2d2
- plot2d3
- plot2d4
- polarplot
Please note that the recommended version of Scilab is 2026.1.0. This page might be outdated.
However, this page did not exist in the previous stable version.
fplot2d
2D plot of a curve defined by a function
Calling Sequence
fplot2d(xr,f,[style,strf,leg,rect,nax])
fplot2d(xr,f,<opt_args>)
Arguments
- xr
vector.
- f
external of type
y=f(x)i.e. a scilab function or a dynamically linked routine referred to as a string.- style,strf,leg,rect,nax
see
plot2d- <opt_args>
see
plot2d
Description
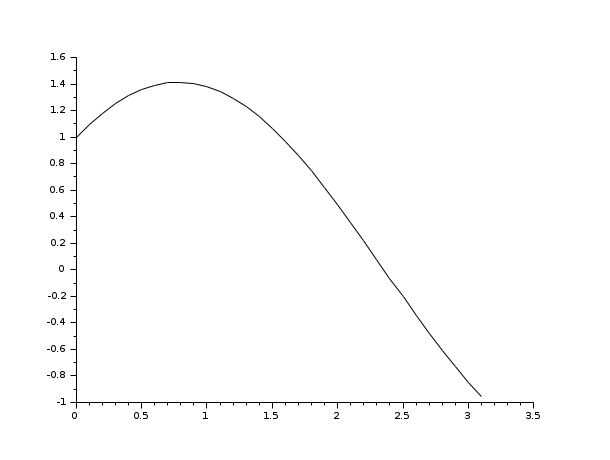
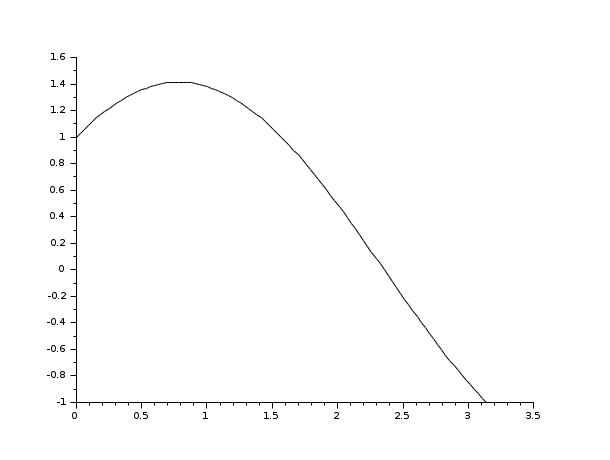
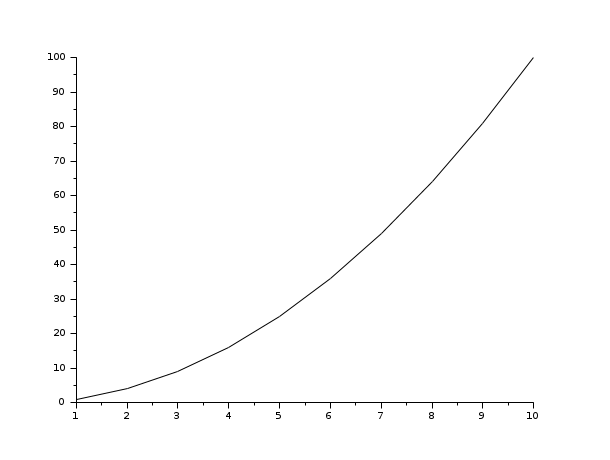
fplot2d plots a curve defined by the external function
f. The curve is approximated by a piecewise linear
interpolation using the points (xr(i),f(xr(i)). The values of
f(x) are obtained by feval(xr,f).
Enter the command fplot2d() to see a demo.
Sample
See Also
- plot2d — 2D plot
- feval — évaluation multiple d'une fonction
- paramfplot2d — animation dans le plan d'une courbe définie par une fonction
| Report an issue | ||
| << fec properties | 2d_plot | grayplot >> |