Scilab 5.4.1
Please note that the recommended version of Scilab is 2026.0.1. This page might be outdated.
However, this page did not exist in the previous stable version.
datatipRedraw
Redraw all datatips after a 3D rotation to adjust their positions
Calling Sequence
datatipRedraw()
datatipRedraw(axes_handle)
datatipRedraw(curve_handles)
Arguments
- axes_handle
The handle on an axes entity.
- curve_handles
An array of handle on entities supporting the datatips
Description
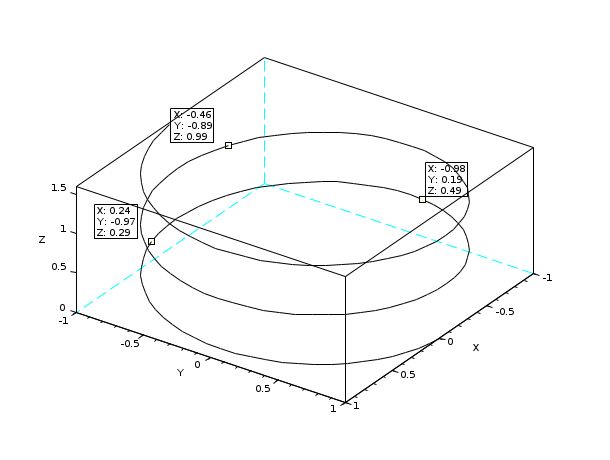
Due to graphic system limitations it is not possible to adjust the datatip textbox positions during a rotation. Calling this function recomputes the positions for a clean rendering.
Examples
clf();
param3d()
p=gce();//get the handle on the polyline
datatipCreate(p,30);
datatipCreate(p,100);
datatipCreate(p,50);
ax=gca();
ax.rotation_angles=[35 45];// first plot below
sleep(2)
datatipRedraw() //second plot below


See Also
- datatips — Tool for placing and editing tips along the plotted curves.
| Report an issue | ||
| << datatipMove | Datatips | datatipRemove >> |