Scilab 5.4.1
Please note that the recommended version of Scilab is 2026.1.0. This page might be outdated.
See the recommended documentation of this function
interpln
linear interpolation
Calling Sequence
[y]=interpln(xyd,x)
Arguments
- xyd
2 row matrix (xy coordinates of points)
- x
vector (abscissae)
- y
vector (y-axis values)
Description
given xyd a set of points in the xy-plane which
increasing abscissae and x a set of abscissae, this
function computes y the corresponding y-axis values by
linear interpolation.
Examples
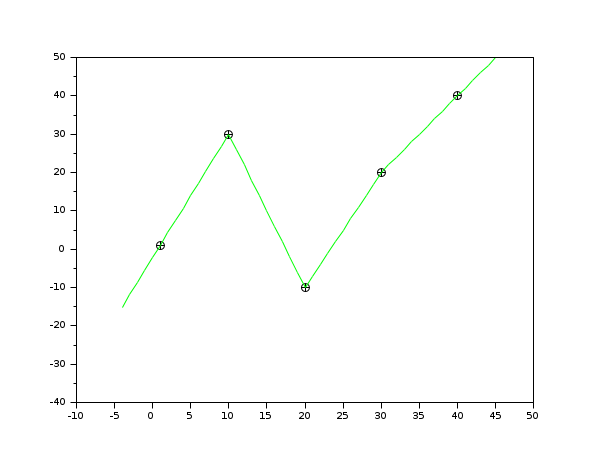
x=[1 10 20 30 40];
y=[1 30 -10 20 40];
plot2d(x',y',[-3],"011"," ",[-10,-40,50,50]);
yi=interpln([x;y],-4:45);
plot2d((-4:45)',yi',[3],"000");
See Also
| Report an issue | ||
| << interp3d | Interpolation | linear_interpn >> |