- Scilab help
- Graphics
- Color management
- addcolor
- autumncolormap
- bonecolormap
- color
- color_list
- colorbar
- colordef
- colormap
- coolcolormap
- coppercolormap
- getcolor
- graycolormap
- hotcolormap
- hsv2rgb
- hsvcolormap
- jetcolormap
- name2rgb
- oceancolormap
- pinkcolormap
- rainbowcolormap
- rgb2name
- springcolormap
- summercolormap
- whitecolormap
- wintercolormap
Please note that the recommended version of Scilab is 2026.1.0. This page might be outdated.
See the recommended documentation of this function
colorbar
draw a colorbar
Calling Sequence
colorbar(umin, umax [, colminmax, fmt])
Arguments
- umin
real scalar, the minimum value associated with the plot
- umax
real scalar, the maximum value associated with the plot
- colminmax
(optional) a vector with 2 integer components
- fmt
(optional) a string to set up the display format for colorbar graduations
Description
Draw a colorbar for a plot3d, fec, Sgrayplot, etc... The function may be called BEFORE the plot3d, fec, Sgrayplot,... because its sets and changes the frame for the plot. This way the colorbar is not part of the associated plot and so is not modified by a zoom or a rotation.
The optional argument colminmax may be used to precise the first color
(associated with umin) and the last color (associated with umax) of the current
colormap. By default colminmax=[1 nb_colors] where nb_colors is the
number of colors of the current colormap.
The optional argument fmt is a string containing a
C-format, like "%.2f", "%e", etc...
For the 2 optional arguments you can use the syntax
keyword=value (see the last example).
Examples
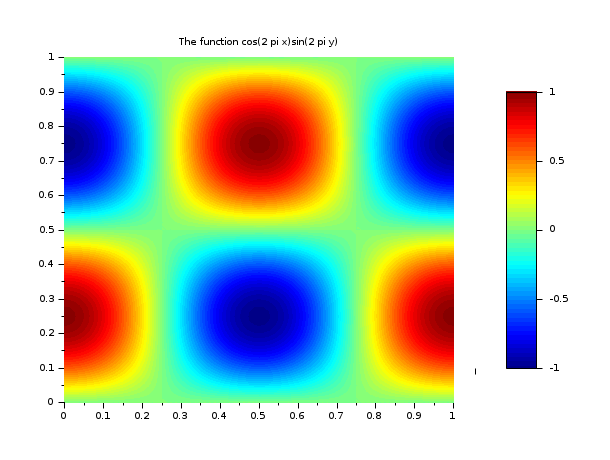
// example 1
x = linspace(0,1,81);
z = cos(2*%pi*x)'*sin(2*%pi*x);
zm = min(z); zM = max(z);
clf()
xset("colormap",jetcolormap(64))
colorbar(zm,zM)
Sgrayplot(x,x,z)
xtitle("The function cos(2 pi x)sin(2 pi y)")
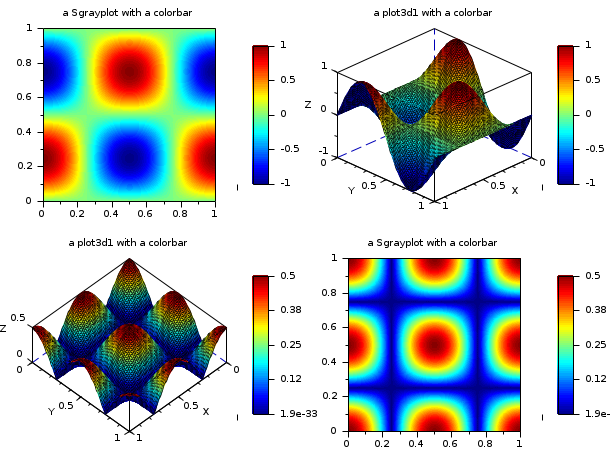
// example 2
x = linspace(0,1,81);
z = cos(2*%pi*x)'*sin(2*%pi*x);
zm = min(z); zM = max(z);
zz = abs(0.5*cos(2*%pi*x)'*cos(2*%pi*x));
zzm = min(zz); zzM = max(zz);
clf();
xset("colormap",jetcolormap(64))

drawlater() ;
subplot(2,2,1)
   colorbar(zm,zM)
   Sgrayplot(x,x,z, strf="031", rect=[0 0 1 1])
   xtitle("a Sgrayplot with a colorbar")
subplot(2,2,2)
   colorbar(zm,zM)
   plot3d1(x,x,z)
   xtitle("a plot3d1 with a colorbar")
subplot(2,2,3)
   colorbar(zzm,zzM)
   plot3d1(x,x,zz)
   xtitle("a plot3d1 with a colorbar")
subplot(2,2,4)
   colorbar(zzm,zzM)
   Sgrayplot(x,x,zz, strf="031", rect=[0 0 1 1])
   xtitle("a Sgrayplot with a colorbar")
drawnow() ;
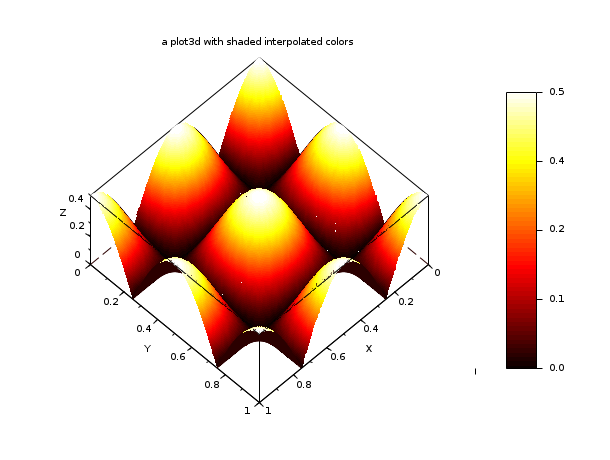
// example 3
x = linspace(0,1,81);
zz = abs(0.5*cos(2*%pi*x)'*cos(2*%pi*x));
zzm = min(zz); zzM = max(zz);
[xf,yf,zf]=genfac3d(x,x,zz);
nb_col = 64;
clf()
xset("colormap",hotcolormap(nb_col))
drawlater() ;
colorbar(zzm,zzM,[1, nb_col],fmt="%.1f")
nbcol = xget("lastpattern")
zcol = dsearch(zf, linspace(zzm, zzM, nb_col+1));
plot3d(xf, yf, list(zf, zcol), flag = [-2 6 4])
xtitle("a plot3d with shaded interpolated colors")
drawnow() ;
show_window()
See Also
- colormap — using colormaps
| Report an issue | ||
| << color_list | Color management | colordef >> |