Please note that the recommended version of Scilab is 2026.1.0. This page might be outdated.
See the recommended documentation of this function
black
diagrama de Black (carta de Nichols)
Seqüência de Chamamento
black( sl,[fmin,fmax] [,step] [,comments] )
black( sl,frq [,comments] )
black(frq,db,phi [,comments])
black(frq,repf [,comments])
Parâmetros
- sl
lista ( sistema linear
syslin)- fmin,fmax
reais (limites de freqüência)
- frq
vetor linha ou matriz (freqüências)
- db,phi
vetores linhas ou matrizes (módulo, fase)
- repf
vetores linhas ou matrizes (resposta de freqüência complexa)
- step
real
- comments
string
Descrição
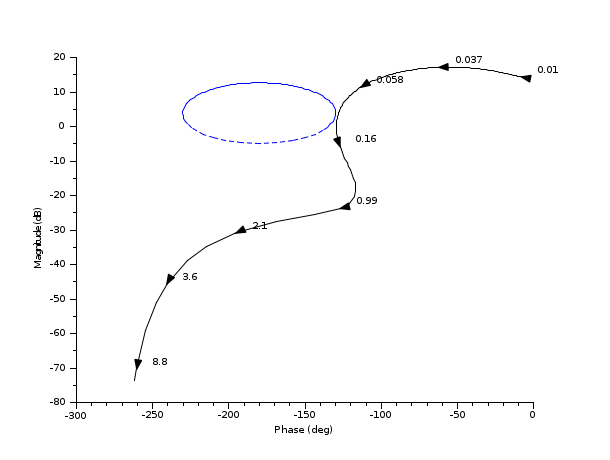
Diagrama de Black (carta de Nichols) para um sistema linear
sl. sl pode ser um sistema SIMO de
tempo contínuo ou discreto (ver syslin). No caso de
múltiplas saídas, elas são esboçadas com símbolos diferentes.
As freqüências são dadas pelos limites
fmin,fmax (em Hz) ou por um vetor
linha (ou uma matriz para múltiplas saídas) frq.
step é o passo de discretização ( logarítmica).
(ver calfrq para escolha do valor padrão).
comments é um vetor de strings (legendas).
db,phi são matrizes de módulos (em Db) e fases
(em graus). (Uma linha para cada resposta).
repf matriz de números complexos. Uma linha para
cada resposta.
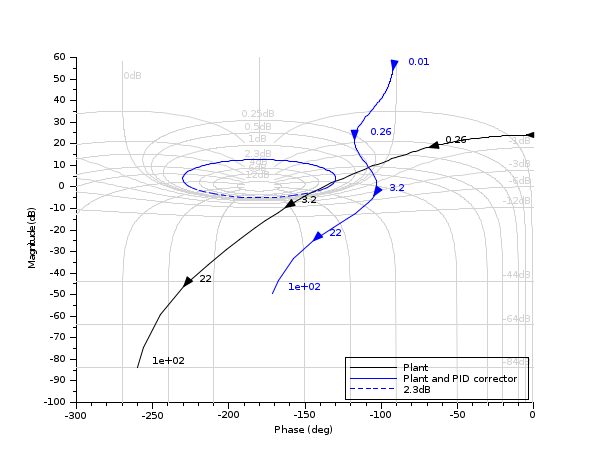
Para esboçar o grid de iso-ganho e iso-fase de
y/(1+y) use chart().
Valores padrões para fmin e
fmax são 1.d-3,
1.d+3 se sl for de tempo contínuo ou
1.d-3, 0.5/sl.dt (freqüência de
Nyquist) se sl for de tempo discreto.
Exemplos
//Black diagram
s=poly(0,'s');
sl=syslin('c',5*(1+s)/(.1*s^4+s^3+15*s^2+3*s+1))
clf();black(sl,0.01,10);
//Black diagram with Nichols chart as a grid
s=poly(0,'s');
Plant=syslin('c',16000/((s+1)*(s+10)*(s+100)));
//two degree of freedom PID
tau=0.2;xsi=1.2;
PID=syslin('c',(1/(2*xsi*tau*s))*(1+2*xsi*tau*s+tau^2*s^2));
clf();
black([Plant;Plant*PID ],0.01,100,["Plant";"Plant and PID corrector"]);
//move the caption in the lower rigth corner
ax=gca();Leg=ax.children(1);
Leg.legend_location="in_lower_right";
nicholschart(colors=color('light gray')*[1 1])
| Report an issue | ||
| << Plot and display | Plot and display | bode >> |