Please note that the recommended version of Scilab is 2026.1.0. This page might be outdated.
See the recommended documentation of this function
isoview
set scales for isometric plot (do not change the size of the window)
Calling Sequence
isoview(xmin,xmax,ymin,ymax)
Arguments
- xmin,xmax,ymin,ymax
four real values
Description
This function is obsolete, use preferably the frameflag=4 plot2d
option which enable window resizing.
isoview is used to have isometric scales on the x and y axes.
It does not change the size of the graphics window. The rectangle
xmin, xmax, ymin, ymax will be contained in the computed frame of
the graphics window. isoview set the current graphics scales
and can be used in conjunction with graphics routines which request
the current graphics scale (for instance strf="x0z" in plot2d).
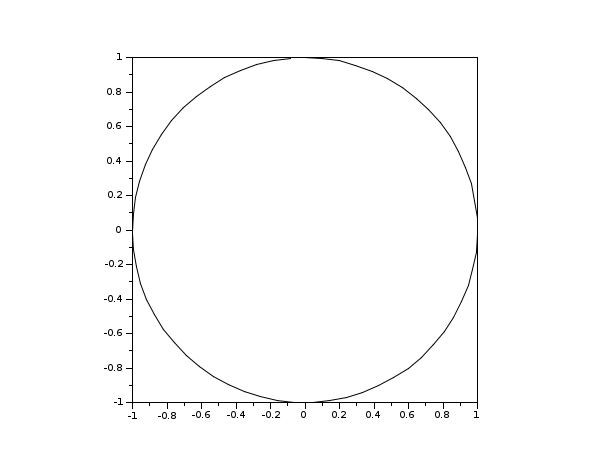
Examples
t=[0:0.1:2*%pi]';
plot2d(sin(t),cos(t))
clf()
isoview(-1,1,-1,1)
plot2d(sin(t),cos(t),1,"001")

plot2d(sin(t),cos(t),frameflag=4)
See Also
| Report an issue | ||
| << gda | axes_operations | newaxes >> |