Scilab 5.4.0
- Scilab help
- Graphics
- 2d_plot
- LineSpec
- Matplot
- Matplot1
- Matplot_properties
- Sfgrayplot
- Sgrayplot
- champ
- champ1
- champ_properties
- comet
- contour2d
- contour2di
- contourf
- errbar
- fchamp
- fcontour2d
- fec
- fec_properties
- fgrayplot
- fplot2d
- grayplot
- grayplot_properties
- graypolarplot
- histplot
- paramfplot2d
- plot
- plot2d
- plot2d1
- plot2d2
- plot2d3
- plot2d4
- polarplot
Please note that the recommended version of Scilab is 2026.1.0. This page might be outdated.
However, this page did not exist in the previous stable version.
fplot2d
2D plot of a curve defined by a function
Calling Sequence
fplot2d(xr,f,[style,strf,leg,rect,nax])
fplot2d(xr,f,<opt_args>)
Arguments
- xr
vector.
- f
external of type
y=f(x)i.e. a scilab function or a dynamically linked routine referred to as a string.- style,strf,leg,rect,nax
see
plot2d- <opt_args>
see
plot2d
Description
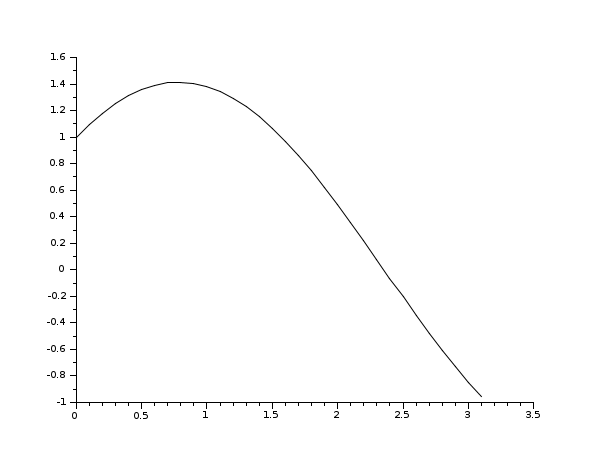
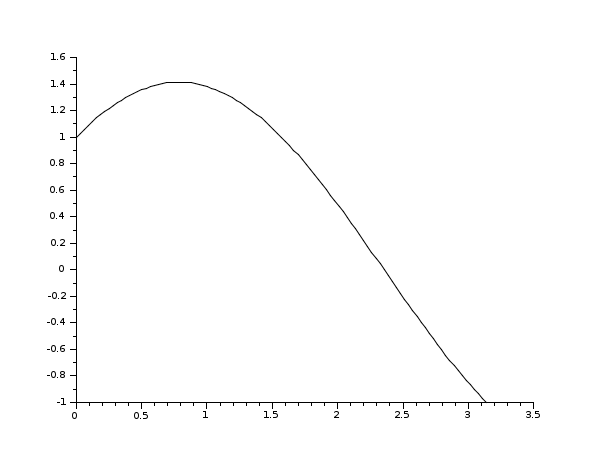
fplot2d plots a curve defined by the external function
f. The curve is approximated by a piecewise linear
interpolation using the points (xr(i),f(xr(i)). The values of
f(x) are obtained by feval(xr,f).
Enter the command fplot2d() to see a demo.
Sample
See Also
- plot2d — 2D plot
- feval — multiple evaluation
- paramfplot2d — animated plot of a 2D parametrized curve.
| Report an issue | ||
| << fgrayplot | 2d_plot | grayplot >> |