- Scilab help
- Graphics
- 2d_plot
- LineSpec
- Matplot
- Matplot1
- Matplot_properties
- Sfgrayplot
- Sgrayplot
- champ
- champ1
- champ_properties
- comet
- contour2d
- contour2di
- contourf
- errbar
- fchamp
- fcontour2d
- fec
- fec_properties
- fgrayplot
- fplot2d
- grayplot
- grayplot_properties
- graypolarplot
- histplot
- paramfplot2d
- plot
- plot2d
- plot2d1
- plot2d2
- plot2d3
- plot2d4
- polarplot
Please note that the recommended version of Scilab is 2026.1.0. This page might be outdated.
See the recommended documentation of this function
fchamp
direction field of a 2D first order ODE
Calling Sequence
fchamp(f,t,xr,yr,[arfact,rect,strf])
fchamp(f,t,xr,yr,<opt_args>)
Arguments
- f
An external (function or character string) or a list which describes the ODE.
- -
It can be a function name
f, wherefis supposed to be a function of typey=f(t,xy [p1,..pn]).freturns a column vector of size 2,y, which gives the value of the direction fieldfat pointxy=[x,y]and at timet.- -
It can also be an object of type list,
list(f,P1,..Pn)wherefis a function of typey=f(t,xy,p1,..pn)andPigives the value of the parameterpi.
- t
The selected time.
- xr,yr
Two row vectors of size n1 and n2 which define the grid on which the direction field is computed.
- <opt_args>
This represents a sequence of statements
key1=value1,key2=value2, ... wherekey1,key2,...can be one of the following: arfact, rect, strf (see below).- arfact,rect,strf
Optional arguments, see
champ.
Description
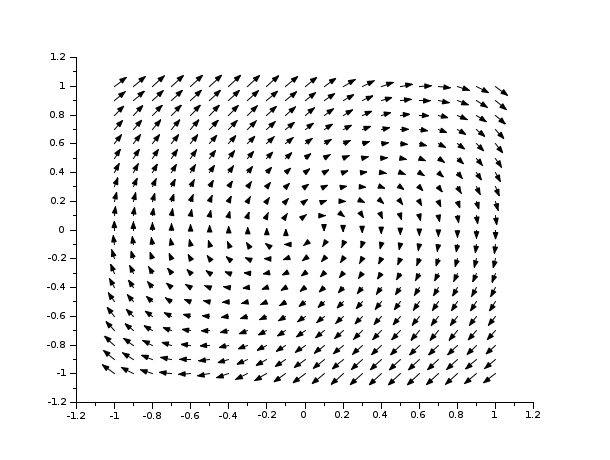
fchamp is used to draw the direction field of a 2D first
order ODE defined by the external function f. Note that if
the ODE is autonomous, argument t is useless, but it must be
given.
Enter the command fchamp() to see a demo.
Examples
deff("[xdot] = derpol(t,x)",..
        ["xd1 = x(2)";..
         "xd2 = -x(1) + (1 - x(1)**2)*x(2)";..
         "xdot = [ xd1 ; xd2 ]"])
xf= -1:0.1:1;
yf= -1:0.1:1;
fchamp(derpol,0,xf,yf)
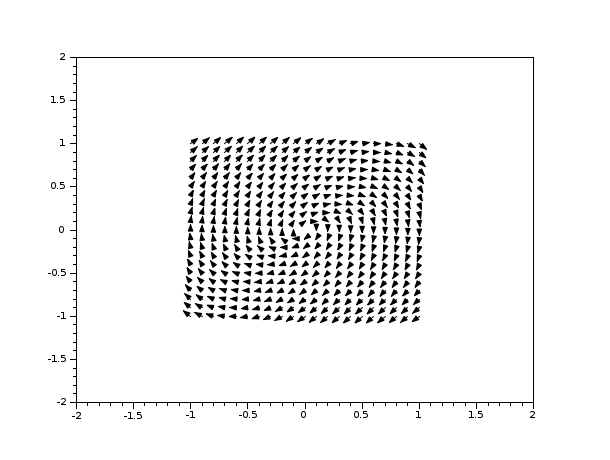
deff("[xdot] = derpol(t,x)",..
        ["xd1 = x(2)";..
         "xd2 = -x(1) + (1 - x(1)**2)*x(2)";..
         "xdot = [ xd1 ; xd2 ]"])
xf= -1:0.1:1;
yf= -1:0.1:1;
clf()
fchamp(derpol,0,xf,yf,1,[-2,-2,2,2],"011")
| Report an issue | ||
| << errbar | 2d_plot | fcontour2d >> |