- Scilab help
- Graphics
- 2d_plot
- 3d_plot
- annotation
- axes_operations
- axis
- bar_histogram
- Color management
- Datatips
- figure_operations
- geometric_shapes
- handle
- interaction
- load_save
- pie
- polygon
- property
- style
- text
- transform
- window_control
- GlobalProperty
- Graphics: Getting started
- alufunctions
- clear_pixmap
- Compound_properties
- graphics_entities
- object_editor
- pixel_drawing_mode
- plzr
- rubberbox
- segs_properties
- show_pixmap
- square
- twinkle
- xbasr
- xchange
- xclear
- xdel
- xget
- xgetech
- xgraduate
- xgrid
- xname
- xnumb
- xpause
- xsegs
- xset
- xsetech
- xsetm
Please note that the recommended version of Scilab is 2026.1.0. This page might be outdated.
See the recommended documentation of this function
segs_properties
description of the Segments entity properties
Description
The Segs entity is a leaf of the graphics entities hierarchy. This entity defines the parameters for a set of colored segments or colored arrows.
- parent:
This property contains the handle of the parent. The parent of the segment entity should be of the type
"Axes"or"Compound".- children:
This property contains a vector with the
childrenof the handle. However,segshandles currently do not have anychildren.- visible:
This field contains the
visibleproperty value for the entity . It should be"on"or"off". By default, the segments are visibles, the value's property is"on". If"off"the segments are not drawn on the screen.- data:
This field is two column matrix
[x,y,[z]]which gives the coordinates of the segments boundary. Ifxv=matrix(x,2,-1)andyv=matrix(y,2,-1)thenxv(:,k)andyv(:,k)are the boundary coordinates of the segment numberedk.- line_mode:
This field contains the default
line_modeproperty value for the segs. Its value should be"on"(line drawn) or"off"(no line drawn).- line_style:
The
line_styleproperty value should be an integer in [0 8]. 0 and 1 stands for solid, the other value stands for a selection of dashes (see getlinestyle).- thickness:
This property is a positive real specifying the arrow width in pixels. The displayed width is actually determined by rounding the supplied width to the nearest integer. The only exception is vectorial export where the whole
thicknessvalue is considered.- arrow_size:
Factor that specify the size of a arrowheads. With a negative value, the size is also dependent of the arrows length. TO draw segment, the value must be set to 0.
- segs_color:
This field contains the vector of colors to use to draw each segment. Each element is a color index relative to the current colormap.
- mark_mode:
This field contains the default
mark_modeproperty value for the polyline. Its value should be"on"(marks drawn) or"off"(no marks drawn).- mark_style:
The
mark_styleproperty value is used to select the type of mark to use whenmark_modeproperty is"on". The value should be an integer in [0 14] which stands for: dot, plus, cross, star, filled diamond, diamond, triangle up, triangle down, diamond plus, circle, asterisk, square, triangle right, triangle left and pentagram. The figure below shows the aspects of the marks depending on themark_styleand themark_foregroundandmark_backgroundproperties.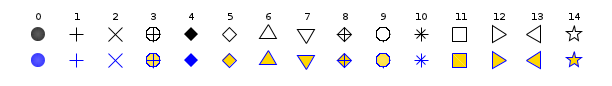
- mark_size_unit:
This field contains the default
mark_size_unitproperty value. Ifmark_size_unitis set to"point", then themark_sizevalue is directly given in points. Whenmark_size_unitis set to"tabulated",mark_sizeis computed relative to the font size array: therefore, its value should be an integer in [0 5] which stands for 8pt, 10pt, 12pt, 14pt, 18pt and 24pt. Note that plot2d and pure scilab functions usetabulatedmode as default ; when using plot function, thepointmode is automatically enabled.- mark_size:
The
mark_sizeproperty is used to select the type of size of the marks whenmark_modeproperty is"on". Its value should be an integer between 0 and 5 whith stands for 8pt, 10pt, 12pt, 14pt, 18pt and 24pt.- mark_foreground:
This field contains the
mark_foregroundproperty value which is the marks' edge color. Its value should be a color index (relative to the current color_map) or 0 for transparant edge.- mark_background:
This field contains the
mark_backgroundproperty value which is the marks' face color. Its value should be a color index (relative to the current color_map) or 0 for transparant face.- clip_state:
This field contains the
clip_stateproperty value for the segments. It should be :"off"this means that the segments is not clipped."clipgrf"this means that the segments is clipped outside the Axes box."on"this means that the segments is clipped outside the rectangle given by the propertyclip_box.
- clip_box:
This field contains the
clip_boxproperty. By default segment are not clipped, clip_state is "off", so the value should be an empty matrix .Other cases the vector[x,y,w,h](upper-left point width height) defines the portions of the segments to display, howeverclip_stateproperty value will be changed.- user_data:
This field can be use to store any scilab variable in the segs data structure, and to retreive it.
Examples
a=get("current_axes");//get the handle of the newly created axes
a.data_bounds=[-10,-10;10,10];
x=2*%pi*(0:7)/8;
xv=[2*sin(x);9*sin(x)];
yv=[2*cos(x);9*cos(x)];
xsegs(xv,yv,1:8)

s=a.children
s.arrow_size=1;
s.segs_color=15:22;
for j=1:2
  for i=1:8
    h=s.data(i*2,j);
    s.data(i*2,j)=s.data(i*2-1,j);
    s.data(i*2-1,j)=  h;
  end
end

s.segs_color=5; //set all the colors to 5

s.clip_box=[-4,4,8,8];
a.thickness=4;
xrect(s.clip_box);
See Also
- set — set a property value of a graphic entity object or of a User Interface object.
- get — Retrieve a property value from a graphics entity or an User Interface object.
- delete — delete a graphic entity and its children.
- xsegs — draw unconnected segments
- graphics_entities — description of the graphics entities data structures
Authors
Djalel ABDMOUCHE
| << rubberbox | Graphics | show_pixmap >> |