Please note that the recommended version of Scilab is 2026.1.0. This page might be outdated.
See the recommended documentation of this function
datatipCreate
Create a data tip on a polyline by program
Calling Sequence
datatip_handle = datatipCreate(polyline_handle,index)
datatip_handle = datatipCreate(polyline_handle,pt)
Arguments
- polyline_handle
A handle on a polyline
- index
The index of a polyline data point where to draw the data tip.
- pt
A vector with 2 elements, the coordinates of the point where to draw the data tip.
- datatip_handle
The handle on the newly created entity
Description
This function can be used to create data tips on a curve by program. Called with an index, it set the tip at the coordinates given by polyline point specified by the index. Called with point it set the tip at the coordinates corresponding to the orthogonal projection of the point on the curve if the interpolation mode is on or to the nearest mesh point.
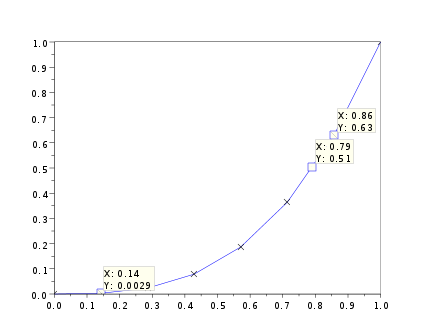
Examples
x=linspace(0,1,8)';
y=x.^3;
clf();
plot(x,y);
e=gce();p=e.children(1);//get the handle on the polyline
p.mark_mode="on";p.mark_style=2;p.mark_size=5;
t=datatipCreate(p,2);

datatipCreate(p,[0.8,0.5]);
datatipSetInterp(p,%t);
datatipCreate(p,[0.8,0.5]);
See Also
Authors
- Serge Steer, INRIA
| << Datatips | Datatips | datatipGetEntities >> |