Please note that the recommended version of Scilab is 2026.1.0. This page might be outdated.
See the recommended documentation of this function
surface_properties
description of the 3D entities properties
Description
The Surface entity is a leaf of the graphics entities hierarchy. Two
classes appears under this type of entity : Plot3d and
Fac3d according to the ploting function or the way data is
entered. Fac3d and Plo3d entities are similar
but Fac3d is more complete and accept more options than
Plot3d. To always have Fac3d entities, simply
use genfac3d to pre-build matrices before using
plot3d or use the surf command.
Here are the properties contained in a surface entity:
- parent:
This property contains the handle of the parent. The parent of the surface entity should be of type
"Axes"or"Compound".- children:
This property contains a vector with the
childrenof the handle. However, surface handles currently do not have anychildren.- visible:
This field contains the
visibleproperty value for the entity . It should be"on"or"off". By default, surfaces are visibles, the value's property is"on". If"off"the 3D graphics are not displayed on the screen.- surface_mode:
This field contains the default
surface_modeproperty value for the surface. Its value should be"on"(surface drawn) or"off"(no surface drawn).- foreground:
If
color_mode >= 0, this field contains the color index used to draw the edges. If not, foreground is not used at all. The foreground value should be an integer color index (relative to the current colormap).- thickness:
This property is a positive real specifying the width of facets contours in pixels. The displayed width is actually determined by rounding the supplied width to the nearest integer. The only exception is vectorial export where the whole
thicknessvalue is considered.- mark_mode:
This field contains the default
mark_modeproperty value for the surface. Its value should be"on"(marks drawn) or"off"(no marks drawn).- mark_style:
The
mark_styleproperty value is used to select the type of mark to use whenmark_modeproperty is"on". The value should be an integer in [0 14] which stands for: dot, plus, cross, star, filled diamond, diamond, triangle up, triangle down, diamond plus, circle, asterisk, square, triangle right, triangle left and pentagram.The figure below shows the aspects of the marks depending on themark_styleand themark_foregroundandmark_backgroundproperties.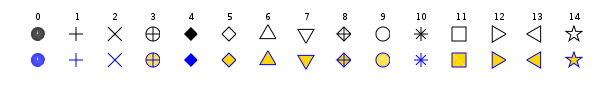
- mark_size_unit:
This field contains the default
mark_size_unitproperty value. Ifmark_size_unitis set to"point", then themark_sizevalue is directly given in points. Whenmark_size_unitis set to"tabulated",mark_sizeis computed relative to the font size array: therefore, its value should be an integer in [0 5] whith stands for 8pt, 10pt, 12pt, 14pt, 18pt and 24pt. Note that plot3d and pure scilab functions usetabulatedmode as default ; when using the surf (or plot for 2D lines) function, thepointmode is automatically enabled.- mark_size:
The
mark_sizeproperty is used to select the type of size of the marks whenmark_modeproperty is"on". Its value should be an integer between 0 and 5 whith stands for 8pt, 10pt, 12pt, 14pt, 18pt and 24pt.- mark_foreground:
This field contains the
mark_foregroundproperty value which is the marks' edge color. Its value should be a color index (relative to the current color_map) or 0 for transparant edge.- mark_background:
This field contains the
mark_backgroundproperty value which is the marks' face color. Its value should be a color index (relative to the current color_map) or 0 for transparant face.- data:
This field defines a
tlistdata structure of type "3d" composed of a row and column indices of each element as the x-, y- and z-coordinates contained respectivly indata.x,data.yanddata.z. The complementary field nameddata.coloris available in case a real color vector or matrix is specified. If none,data.coloris not listed. The surface is painted according tocolor_modeandcolor_flagproperties.- color_mode:
an integer between
[-size(colormap) ; size(colormap)]defining the color of the facet whencolor_flagvalue is0. As stated before, ifcolor_mode > 0, edges are drawn usingforegroundcolor. Ifcolor_modeis set to0, a mesh of the surface is drawn: front faces have no colors. Finally, whencolor_mode < 0, front faces are painted with color-color_modebut no edges are displayed.- color_flag:
This field is used to specify the algorithm used to set facets' colors.
Not that the rules on
color_mode,foregroundandhiddencolorare still applied to this case.color_flag == 0All facets are painted using the color index and method defined by
color_mode(see above).
color_flag == 1All facets are painted using one color index per facet proportional to
z. The minimumzvalue is painted using the index 1 color while the maximumzvalue is painted using highest color index. The edges of the facets can be additionnaly drawn depending on the value ofcolor_mode(see above).
The 3 remaining cases (
color_flag== 2,3 or 4) are only available only withFac3dentity. Then, thedata.colorvalue is used to set colors for facets (indices in the current colormap) if it exists. If not, the currentcolor_modeis used to paint the facets.color_flag == 2 ('flat' shading)All facets are painted using the color index given in the
data.colorproperty (one color per facet is needed). Two cases are then possible :data.colorcontains acolorvector : ifcolor(i)is positive it gives the color of facetiand the boundary of the facet is drawn with current line style and color. Ifcolor(i)is negative, color id-color(i)is used and the boundary of the facet is not drawn.data.colorcontains a color matrix of size (nf,n) wherenstands for the number of facets andnffor the number of points defining the polygonal facet. For thenfvertices defining each facet, the algorithm computes anaverage valueof the color index (from the matrix color index) : thenfvertices of the same facet will have the same color index value.
color_flag == 3 ('interpolated' shading)Facets painting results of interpolation of vertices colors. The indices of vertices color are given in the
data.colorproperty (one color per vertex is needed). Two cases are possible :data.colorcontains acolorsvector : then, there are too few data to complete the interpolated shading mode. Indeed, a color matrix of size (nf,n) (wherenstands for the number of facets andnffor the number of points defining the polygonal facet) is needed to perform this operation. For each facet, the algorithm copies the single color index value of the facet into thenfcolor indexes vertices defining the facet's boundary.data.colorcontains a color matrix of size (nf,n) (see upper fornfandndefinitions), the interpolated shading mode can be completed normally using those color indexes.
color_flag == 4 (Matlab-like 'flat' shading)Same as
color_flag==2with a slight difference whendata.coloris a matrix. All facets are painted using the color index given in thedata.colorproperty (one color per facet is needed). Two cases are then possible :data.colorcontains acolorvector : ifcolor(i)is positive it gives the color of facetiand the boundary of the facet is drawn with current line style and color. Ifcolor(i)is negative, color id-color(i)is used and the boundary of the facet is not drawn.data.colorcontains a color matrix of size (nf,n) wherenstands for the number of facets andnffor the number of points defining the polygonal facet. For thenfvertices defining each facet, the algorithm takes thecolor of the first vertexdefining the patch (facet).
- cdata_mapping:
Specific to Fac3d handles. A string with value'scaled'or'direct'. If adata.coloris set, each index color data specifies a single value for each vertex.cdata_mappingdetermines wether those indices are scaled to map linearly into the current colormap ('scaled'mode) or point directly into this colormap ('direct' mode). This property is usefull whencolor_flagequals2,3or4.- hiddencolor:
This field contains the color index used to draw the backward faces of a surface. Its value should be a positive integer (color index relative to the current colormap). If it is a negative integer,the same color than the "visible" face is applied to the rear face.
- clip_state:
This field contains the
clip_stateproperty value for the surface. It should be :"off"this means that the surface is not clipped."clipgrf"this means that the surface is clipped outside the Axes box."on"this means that the surface is clipped outside the rectangle given by property clip_box.
- clip_box:
This field is to determinate the
clip_boxproperty. By Default its value should be an empty matrix if clip_state is "off". Other cases the vector[x,y,w,h](upper-left point width height) defines the portions of the surface to display, howeverclip_stateproperty value will be changed.- user_data:
This field can be use to store any scilab variable in the surface data structure, and to retreive it.
Examples
//create a figure
t=[0:0.3:2*%pi]'; z=sin(t)*cos(t');
[xx,yy,zz]=genfac3d(t,t,z);
plot3d([xx xx],[yy yy],list([zz zz+4],[4*ones(1,400) 5*ones(1,400)]))
h=get("hdl") //get handle on current entity (here the surface)
a=gca(); //get current axes
a.rotation_angles=[40,70];
a.grid=[1 1 1];
//make grids
a.data_bounds=[-6,0,-1;6,6,5];
a.axes_visible="off";
//axes are hidden a.axes_bounds=[.2 0 1 1];
f=get("current_figure");
//get the handle of the parent figure
f.color_map=hotcolormap(64);
//change the figure colormap
h.color_flag=1;
//color according to z
h.color_mode=-2;
//remove the facets boundary
h.color_flag=2;
//color according to given colors
h.data.color=[1+modulo(1:400,64),1+modulo(1:400,64)];
//shaded
h.color_flag=3;

scf(2); // creates second window and use surf command
subplot(211)
surf(z,'cdata_mapping','direct','facecol','interp')

subplot(212)
surf(t,t,z,'edgeco','b','marker','d','markersiz',9,'markeredg','red','markerfac','k')
e=gce();
e.color_flag=1 // color index proportional to altitude (z coord.)
e.color_flag=2; // back to default mode
e.color_flag= 3; // interpolated shading mode (based on blue default color because field data.color is not filled)
Authors
Djalel ABDEMOUCHE & F.Leray
| << surf | 3d_plot | annotation >> |