Please note that the recommended version of Scilab is 2026.1.0. This page might be outdated.
See the recommended documentation of this function
orthProj
Computes the orthogonal projection of a point to a polyline in the plane.
Calling Sequence
[d,ptp,ind,c] = orthProj(data,pt)
Arguments
- data
a n by 2 array. The first column contains the X coordinates of the poyline, while the second one contains the Y coordinates.
- pt
an array with 2 entries: the coordinates of the point
- d
The minimum distance between the given point and a polyline data point.
- ptp
an array with 2 entries: the coordinates of the point that realizes the minimum distance
- ind
The polyline closest point lies on the segment
[ind ind+1].- c
The interpolation coefficient of the orthonal projection.
Description
Computes the orthogonal projection of a point to a polyline in the plane.
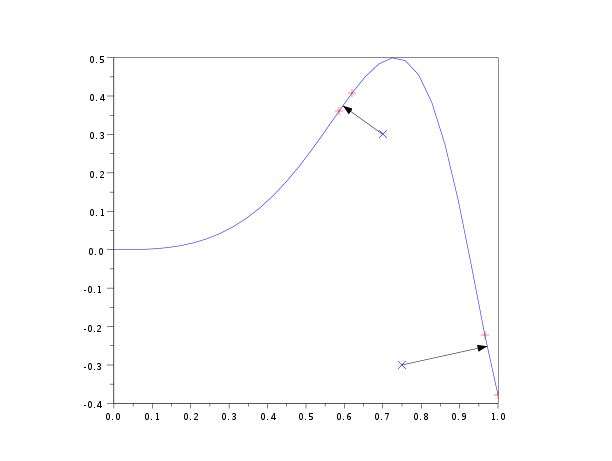
Examples
x=linspace(0,1,30)';
y=sin(4*x.^3)/2;
clf();a=gca();a.isoview='on';
plot(x,y)
pt=[0.7 0.3];
plot(pt(1),pt(2),'xb')
[d,ptp,ind,c]=orthProj([x y],pt);
plot(x(ind:ind+1),y(ind:ind+1),'+r')
xpoly([pt(1);ptp(1)],[pt(2);ptp(2)])
e=gce();e.polyline_style=4;e.arrow_size_factor = 1.5;

pt=[0.75 -0.3];
plot(pt(1),pt(2),'xb')
[d,ptp,ind,c]=orthProj([x y],pt);
plot(x(ind:ind+1),y(ind:ind+1),'+r')
xpoly([pt(1);ptp(1)],[pt(2);ptp(2)])
e=gce();e.polyline_style=4;e.arrow_size_factor = 1.5;
Authors
- Serge Steer, INRIA
| << datatips | Datatips | figure_operations >> |