Please note that the recommended version of Scilab is 2026.1.0. This page might be outdated.
See the recommended documentation of this function
datatips
Tool for placing and editing tips along the plotted curves.
Description
With this tool, it is possible to place, move and modify tips on the curves (polylines). This can be done by program or interactively. The commonly used mode is the interactive one:
The datatips mode can be enabled by datatipToggle() or using the
Edit/Start datatip manager or clicking on the
toolbar icon  of the desired graphic window.
Once enabled, a simple left click on a curve will add a tip ( a small box with informations on the current point) at the nearest datapoint of the curve. By default each curve can have a single tip but it is possible to allow multiple datatips using the right click contextual menu.
To move a tip, press left button on the small square mark on the curve, wait a little and drag it to the desired location.
Right click on the tip mark opens a contextual dialog. This dialog allows in particular to customize the information displayed in all the datatips of the associated curve.
Middle click on the tip mark opens a contextual dialog that allows to manage the orientation of the selected tip.
Examples
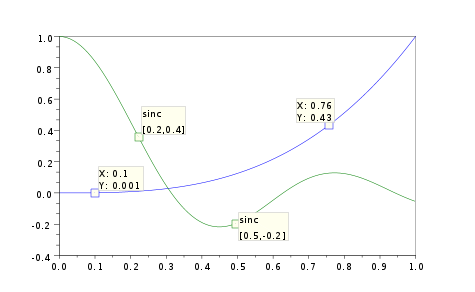
// this examples show how to manage tips by program
x1=linspace(0,1,100)';
y1=x1.^3;
clf();
plot(x1,y1,x1,sinc(10*x1));
e=gce();
p1=e.children(1);//sinc(10*x1)
p2=e.children(2); //x1^3
t=datatipCreate(p1,50);
datatipSetOrientation(t,"lower right")
t=datatipCreate(p1,[0.8 0.5]);
t=datatipCreate(p2,[0.1,0]);
t=datatipCreate(p2,[0.8 0.4]);
datatipSetOrientation(t,"upper left")

function str=myfmt(curve, pt, index)
  str = msprintf('sinc\n%s', sci2exp(round(pt*10)/10))
endfunction
datatipSetDisplay(p1,myfmt) //then modify the function in the editor an ok
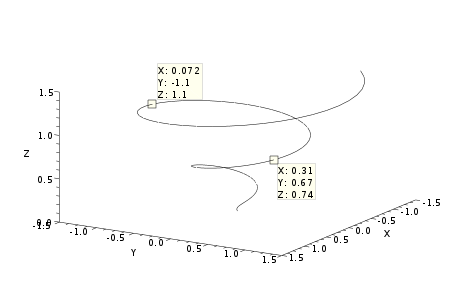
// With 3D curves
x1=linspace(0,1.5,100)';
y1=x1.^3;
clf();
param3d(x1.*cos(10*x1),x1.*sin(10*x1),x1);
ax=gca();ax.box='off';
ax.rotation_angles=[76 31];
p=gce();
t=datatipCreate(p,50);
datatipSetOrientation(t,"lower right")
datatipCreate(p,[0,-1.1,1.1]);
Authors
- Serge Steer, INRIA
| << datatipToggle | Datatips | orthProj >> |