grayplot
2D plot of a surface using colors
Syntax
grayplot(x,y,z,[strf,rect,nax])
grayplot(x,y,z,<opt_args>)
h = grayplot(...)
Arguments
- x, y, z
Real matrices defining the grid and the surface values :
xandycan be row vectors of sizes n1 and n2 andza real matrix of size (n1,n2) (rectangular grid) or the 3 matrices can have the same size (n1,n2) (curvilinear grid).- <opt_args>
This represents a sequence of statements
key1=value1,
                            key2=value2
,... wherekey1,key2,...can be one of the following: rect, nax, strf, logflag or axesflag and frameflag (seeplot2d).- strf,rect,nax
see
plot2d.- h
This optional output contains a handle to a Grayplot entity. Use
hto modify its properties. For a list of properties, see grayplot_properties.
Description
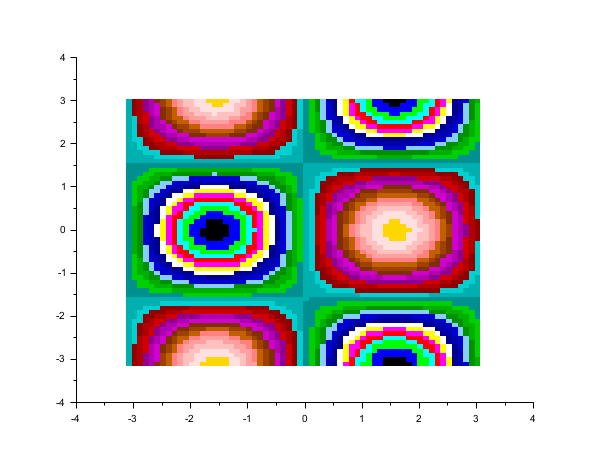
grayplot makes a 2D pseudo-color plot of the surface z
on the grid defined by x and y. Each cell of the grid
is filled with a gray or color level depending on the average value of z
at its corners. If z contains %nan values, the
surrounding cells are not displayed.
When x and y are vectors the grid is rectangular;
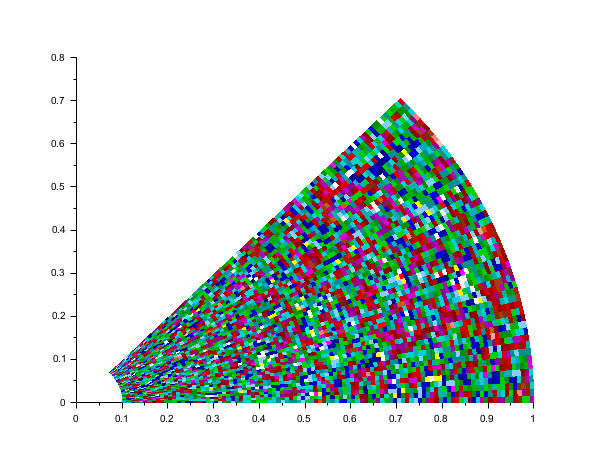
when x, y and z are all matrices
of the same size the grid is non-rectangular, with node (i,j) located at
(x(i,j), y(i,j)) — useful for curvilinear or polar coordinates.
Enter the command grayplot() to see a demo.
Examples
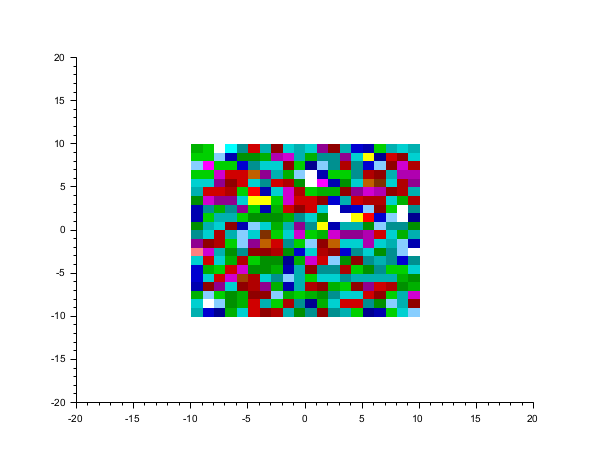
x=-10:10;
y=-10:10;
m=rand(21,21);
grayplot(x,y,m,rect=[-20,-20,20,20])
// Non-rectangular grid: sector of an annulus in polar coordinates
[R,T] = ndgrid(linspace(0.1,1,100), linspace(0,%pi/4,50));
grayplot(R.*cos(T), R.*sin(T), rand(T))
See also
- fgrayplot — représentation 2D en pseudo-couleurs d'une surface définie par une fonction
- plot2d — 2D plot
- Sgrayplot — smooth 2D plot of a surface using colors
- Sfgrayplot — smooth 2D plot of a surface defined by a function using colors
History
| Version | Description |
| 5.5.0 | Option |
| 2025.0.0 | Function returns the created handle(s). |
| 2027.0.0 | Non-rectangular grid mode added: |
| Report an issue | ||
| << fgrayplot | 2d_plot | grayplot properties >> |