fplot3d1
3D gray or color level plot of a surface defined by a function
Syntax
fplot3d1(xr,yr,f,[theta,alpha,leg,flag,ebox])
fplot3d1(xr,yr,f,<opt_args>)
h = fplot3d1(...)
Arguments
- xr
row vector of size n1.
- yr
row vector of size n2.
- f
external of type z=f(x,y).
- theta,alpha,leg,flag,ebox
see
plot3d1.- <opt_args>
see
plot3d.- h
This optional output contains a handle to a
Plot3d. Usehto modify its properties. For a list of properties, see surface_properties.
Description
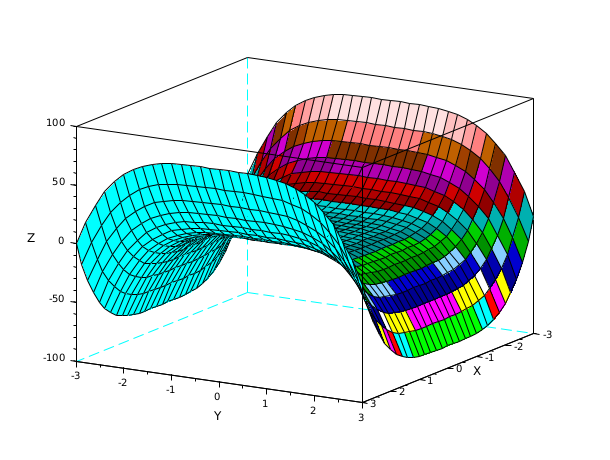
fplot3d1 plots a 3D gray or color level plot of a surface
defined by the external function f on the grid defined by
xr and yr.
Enter the command fplot3d1() to see a demo.
See also
- plot3d1 — 3D gray or color level plot of a surface
History
| Версия | Описание |
| 2025.0.0 | Function returns the created handle(s). |
| Report an issue | ||
| << fplot3d | 3d_plot | genfac3d >> |