barh
horizontal display of bar histogram
Syntax
barh(y)
barh(x,y)
barh([h],x,y [,width [,color [,style]]])
hdl = barh(...)
Arguments
- h
an axes handle, (default: h=gca() ).
- y
a real scalar, vector of size N, or a matrix N*M.
- x
a real scalar or a vector of size N, (default: if y is a vector then x is a vector and x length equals to y length. If y is a matrix then x is a vector and x length equals to the lines number of y.
- width
(optional), a real scalar, defines the width (a percentage of the available room) for the bar (default: 0.8, i.e=80%).
- color
(optional), a string (default: 'blue'), specifying the inside color bar.
- style:
a string, 'grouped' or 'stacked' (default: 'grouped').
- hdl
This optional output contains a handle to a Compound object whose children are the created Polyline objects. Use
hdlto modify properties of a specific or all Polyline objects after they are created. For a list of properties, see polyline_properties.
Description
barh(y,...) : if y is a vector then bar function draws a
polyline which has the polyline_style type 6. If y is a
vector, bar draws vector y versus vector x=1:size(y,'*') . If y is a
matrix N*M, bar draws M polylines (type 6), each polyline corresponds to a
column of y versus vector x=1:size(y,1).
barh(x,y,...) : if y is a vector then bar function draws a
polyline which has the polyline_style type 6, where x length
= y length. If y is a matrix NxM then bar function draws M polylines which
have the type 6. Each polyline corresponds to a column of y versus vector
x.
barh(h,...) : defines the current axes where the drawing
is performed.
barh(...,width,...) : defines the width of the bar(s) in
percentage (generally: 0<width<1).
barh(...,style,...) : defines how the bar is drawn. If y
is a matrix N*M (so M polylines of type 6) then there are two ways to draw
the M bars. the style option = 'grouped' allows to center the M polylines
versus each components of x, and the style option = 'stacked' allows to
stack them.
barh(...,color,...) :defines the bar color. Bar functions
uses the same colormap than in the plot function.
If there are several bar calls, the barhomogenize function
allows to homogenize the width and style of all bars (i.e polylines of
type 6) included in the current working axes.
Examples
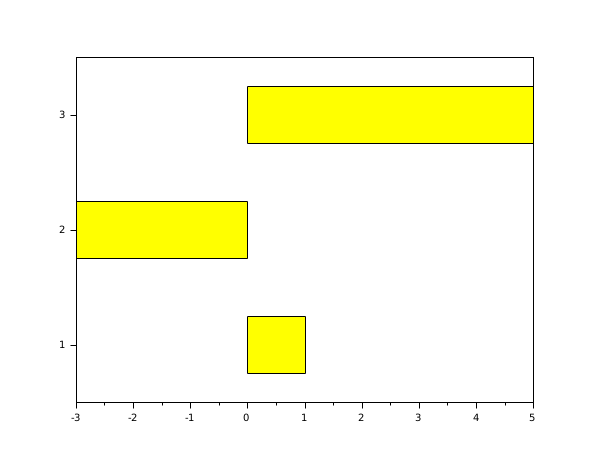
// First example: draw a bar (i.e a polyline with polyline_style type =6),default style='grouped', width=0.5, color='yellow', default x=1:length(y)
scf(0);
y=[1 -3 5];
barh(y,0.5,'yellow');
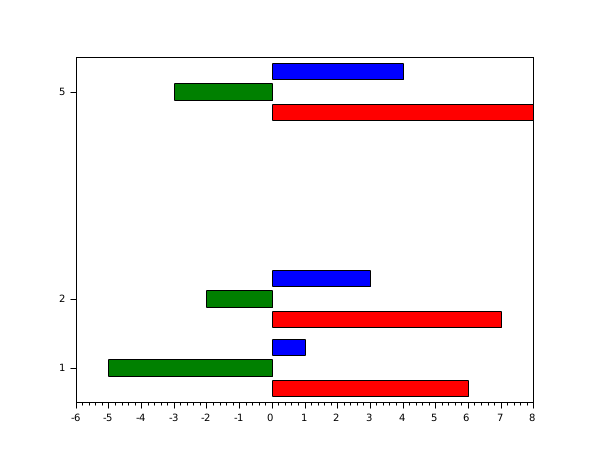
// Second example: draw 3 bars (i.e 3 polylines with polyline_style type =6),default style='grouped'
scf(1);
x=[1 2 5];
y=[1  -5 6;3 -2 7;4  -3 8];
barh(x,y);
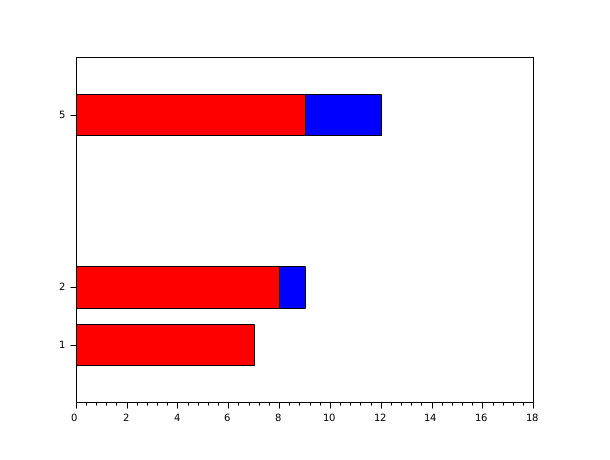
// Third example : style='stacked'.
scf(2);
x=[1 2 5];
y=[1 4 7;2 5 8;3 6  9];
barh(x,y,'stacked');
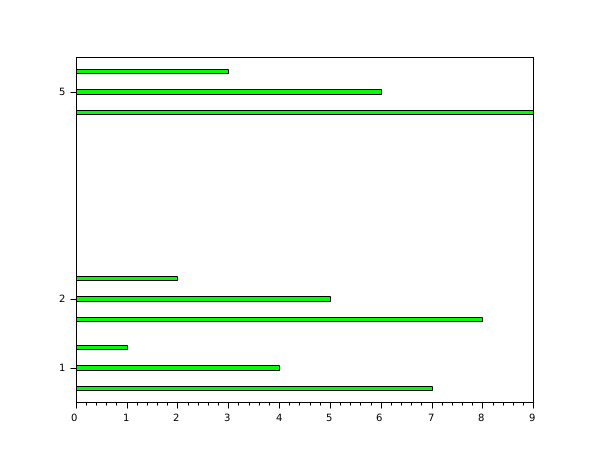
// Fourth example: width=0.2;color='green'; default style='grouped'
scf(3);
x=[1 2 5];
y=[1 4 7;2 5 8;3 6 9];
barh(x,y,0.2,'green');
See also
- bar — bar histogram
- barhomogenize — homogenize all the bars included in the current working axes
- plot — 2D plot
- polyline_properties — description of the Polyline entity properties
History
| Version | Description |
| 2025.0.0 | Function returns the created handle(s). |
| Report an issue | ||
| << bar | bar_histogram | barhomogenize >> |